Aggregating Metrics
This guide explains how to configure OpenTelemetry with Prometheus to collect workload metrics from across multiple virtual clusters and aggregate by Project, vCluster, and Space. This approach uses shared OpenTelemetry DaemonSets on the host cluster without requiring individual collector installations per virtual cluster.
Prerequisites
Before you begin, decide where to deploy Prometheus and Grafana. This guide uses the Platform's connected local-cluster with both services in an observability namespace. You can adapt this to external clusters or different namespaces based on your requirements.
Do not use the kube-prometheus-stack chart from the Platform Apps page for this setup. Instead, use the standalone prometheus and grafana charts as described below, which are optimized to work with the OpenTelemetry Collector.
Deploy Prometheus
Deploy Prometheus with OTLP receiver support using the Platform Apps UI.
Go to the Infra section using the menu on the left, and select the Clusters view.
Click on the cluster where you want to deploy Prometheus (for example,
local-cluster).Navigate to the Apps tab.
Click and configure a Helm chart with the following settings.
| Setting | Value |
|---|---|
| Chart Repository URL | https://prometheus-community.github.io/helm-charts |
| Chart Name | prometheus |
| Namespace | observability |
| Release Name | prometheus |
Use the following chart values to enable the OTLP receiver and required features:
# Enable OTLP receiver for OpenTelemetry metrics ingestion
# Enable delta-to-cumulative conversion for OTLP metrics
# Enable lifecycle API for configuration reloads
server:
  extraFlags:
    - web.enable-otlp-receiver
    - web.enable-lifecycle
  extraArgs:
    enable-feature: otlp-deltatocumulative

# Skip RBAC creation if prometheus-server ClusterRole already exists
rbac:
  create: false

# Disable components not needed for this setup
prometheus-node-exporter:
  enabled: false
alertmanager:
  enabled: false
kube-state-metrics:
  enabled: false
prometheus-pushgateway:
  enabled: false
The rbac.create: false setting skips ClusterRole creation, which prevents conflicts if a prometheus-server ClusterRole already exists in your cluster from vCluster Platform or other components. If you don't have an existing ClusterRole, either remove this setting or use server.clusterRoleNameOverride: "otel-prometheus-server" to create one with a unique name.
Click to deploy Prometheus.
Deploy OpenTelemetry Collector
Deploy the built-in OpenTelemetry App on each connected host cluster. This OpenTelemetry App accepts the Prometheus connection information and deploys opentelemetry-collector as a DaemonSet via Helm.
The OpenTelemetry Collector Agent on each node pushes metrics about the workloads running on that node to the Prometheus instance. The metrics include vCluster, vCluster Platform, and Kubernetes metadata as labels.
Go to the Clusters dropdown using the menu on the left, and select the Clusters view.
Click on the cluster where you are installing the OpenTelemetry Collector App.
Navigate to the Apps tab.
Click on the OpenTelemetry Collector App.
Enter the Prometheus connection endpoint:
http://prometheus-server.observability.svc.cluster.local:80Click on the button to finish.
If you deployed Prometheus in a different namespace or cluster, adjust the endpoint URL accordingly. The format is http://<release-name>-server.<namespace>.svc.cluster.local:80.
Deploy Grafana
Deploy Grafana with a pre-configured Prometheus datasource and dashboard using the Platform Apps UI.
Go to the Clusters dropdown using the menu on the left, and select the Clusters view.
Click on the cluster where you deployed Prometheus.
Navigate to the Apps tab.
Click and configure a Helm chart with the following settings.
| Setting | Value |
|---|---|
| Chart Repository URL | https://grafana.github.io/helm-charts |
| Chart Name | grafana |
| Namespace | observability |
| Release Name | grafana |
Use the following chart values to configure the Prometheus datasource and include a pre-built dashboard:
# Configure Prometheus as the default datasource
datasources:
  datasources.yaml:
    apiVersion: 1
    datasources:
      - name: Prometheus
        type: prometheus
        url: http://prometheus-server
        access: proxy
        isDefault: true

# Configure dashboard provisioning
dashboardProviders:
  dashboardproviders.yaml:
    apiVersion: 1
    providers:
      - name: 'default'
        orgId: 1
        folder: ''
        type: file
        disableDeletion: false
        editable: true
        options:
          path: /var/lib/grafana/dashboards/default

# Include a pre-built dashboard for vCluster Platform metrics
dashboards:
  default:
    vcluster-platform-metrics:
      json: |
        {"title":"CPU and Memory usage by Project, Space, Virtual Cluster","panels":[{"gridPos":{"h":8,"w":12,"x":0,"y":0},"id":3,"options":{"legend":{"calcs":[],"displayMode":"list","placement":"bottom","showLegend":true}},"targets":[{"disableTextWrap":false,"editorMode":"code","expr":"sum by(loft_virtualcluster_name) (k8s_pod_cpu_time_seconds_total{loft_virtualcluster_name=~\".+\"})","fullMetaSearch":false,"includeNullMetadata":true,"instant":false,"legendFormat":"__auto","range":true,"refId":"A","useBackend":false}],"title":"CPU Usage by Virtual Cluster","type":"timeseries"},{"gridPos":{"h":8,"w":12,"x":12,"y":0},"id":4,"options":{"legend":{"calcs":[],"displayMode":"list","placement":"bottom","showLegend":true}},"targets":[{"disableTextWrap":false,"editorMode":"code","expr":"sum by (loft_virtualcluster_name) (k8s_pod_memory_usage_bytes{loft_virtualcluster_name=~\".+\"})\n/1024/1024","fullMetaSearch":false,"includeNullMetadata":true,"instant":false,"legendFormat":"__auto","range":true,"refId":"A","useBackend":false}],"title":"Memory Usage (MiB) by Virtual Cluster","type":"timeseries"},{"gridPos":{"h":8,"w":12,"x":0,"y":8},"id":2,"options":{"legend":{"calcs":[],"displayMode":"list","placement":"bottom","showLegend":true}},"targets":[{"disableTextWrap":false,"editorMode":"builder","expr":"sum by(loft_project_name) (k8s_pod_cpu_time_seconds_total{loft_project_name=~\".+\"})","fullMetaSearch":false,"includeNullMetadata":true,"instant":false,"interval":"","legendFormat":"__auto","range":true,"refId":"A","useBackend":false}],"title":"CPU Usage by Project","type":"timeseries"},{"gridPos":{"h":8,"w":12,"x":12,"y":8},"id":1,"options":{"legend":{"calcs":[],"displayMode":"list","placement":"bottom","showLegend":true}},"targets":[{"disableTextWrap":false,"editorMode":"code","expr":"sum by (loft_project_name) (k8s_pod_memory_usage_bytes{loft_project_name=~\".+\"})\n/1024/1024","fullMetaSearch":false,"includeNullMetadata":true,"instant":false,"legendFormat":"__auto","range":true,"refId":"A","useBackend":false}],"title":"Memory Usage (MiB) by Project","type":"timeseries"},{"gridPos":{"h":8,"w":12,"x":0,"y":16},"id":6,"options":{"legend":{"calcs":[],"displayMode":"list","placement":"bottom","showLegend":true}},"targets":[{"disableTextWrap":false,"editorMode":"code","expr":"sum by(loft_space_name) (k8s_pod_cpu_time_seconds_total{loft_space_name=~\".+\"})","fullMetaSearch":false,"includeNullMetadata":true,"instant":false,"legendFormat":"__auto","range":true,"refId":"A","useBackend":false}],"title":"CPU Usage by Space","type":"timeseries"},{"gridPos":{"h":8,"w":12,"x":12,"y":16},"id":5,"options":{"legend":{"calcs":[],"displayMode":"list","placement":"bottom","showLegend":true}},"targets":[{"disableTextWrap":false,"editorMode":"code","expr":"sum by (loft_space_name) (k8s_pod_memory_usage_bytes{loft_space_name=~\".+\"})\n/1024/1024","fullMetaSearch":false,"includeNullMetadata":true,"instant":false,"legendFormat":"__auto","range":true,"refId":"A","useBackend":false}],"title":"Memory Usage (MiB) by Space","type":"timeseries"}],"schemaVersion":38}
Click to deploy Grafana.
Access Grafana
After deploying Grafana, retrieve the admin password and access the dashboard.
Get the Grafana password
Run the following command to retrieve the Grafana admin password:
kubectl get secret --namespace observability grafana \
  -o jsonpath="{.data.admin-password}" | base64 --decode; echo
Option 1: Port forward
Use port forwarding to access Grafana locally:
kubectl port-forward -n observability service/grafana 8080:80
Then open your browser and navigate to http://localhost:8080. Log in with username admin and the password from the previous step.
Option 2: Ingress
Create an Ingress resource to expose Grafana externally. The following example uses the nginx ingress controller (deprecated):
apiVersion: networking.k8s.io/v1
kind: Ingress
metadata:
  annotations:
    nginx.ingress.kubernetes.io/rewrite-target: /
    # Uncomment the following for TLS with cert-manager:
    # cert-manager.io/cluster-issuer: letsencrypt-prod
    # nginx.ingress.kubernetes.io/ssl-redirect: "true"
  name: grafana
  namespace: observability
spec:
  ingressClassName: nginx
  rules:
    - host: grafana.example.com  # Replace with your hostname
      http:
        paths:
          - backend:
              service:
                name: grafana
                port:
                  number: 80
            path: /
            pathType: Prefix
  # Uncomment the following for TLS:
  # tls:
  #   - hosts:
  #       - grafana.example.com
  #     secretName: grafana-ingress-tls
Apply the Ingress:
kubectl apply -f grafana-ingress.yaml
Navigate to your configured hostname and log in with the admin credentials.
Create Prometheus queries
After collecting data with OpenTelemetry, you can aggregate the metrics using the associated labels like the vCluster name.
Here's an example Prometheus query showing the CPU usage aggregated by the vCluster name:
sum by(loft_virtualcluster_name) (k8s_pod_cpu_time_seconds_total{loft_virtualcluster_name=~".+"})
Available labels
The OpenTelemetry Collector adds the following vCluster Platform labels to metrics:
| Label | Description |
|---|---|
loft_project_name | The vCluster Platform project name |
loft_virtualcluster_name | The virtual cluster name |
loft_space_name | The space name |
loft_cluster_name | The connected cluster name |
Example queries
Memory usage by project:
sum by (loft_project_name) (k8s_pod_memory_usage_bytes{loft_project_name=~".+"}) / 1024 / 1024
CPU usage by space:
sum by(loft_space_name) (k8s_pod_cpu_time_seconds_total{loft_space_name=~".+"})
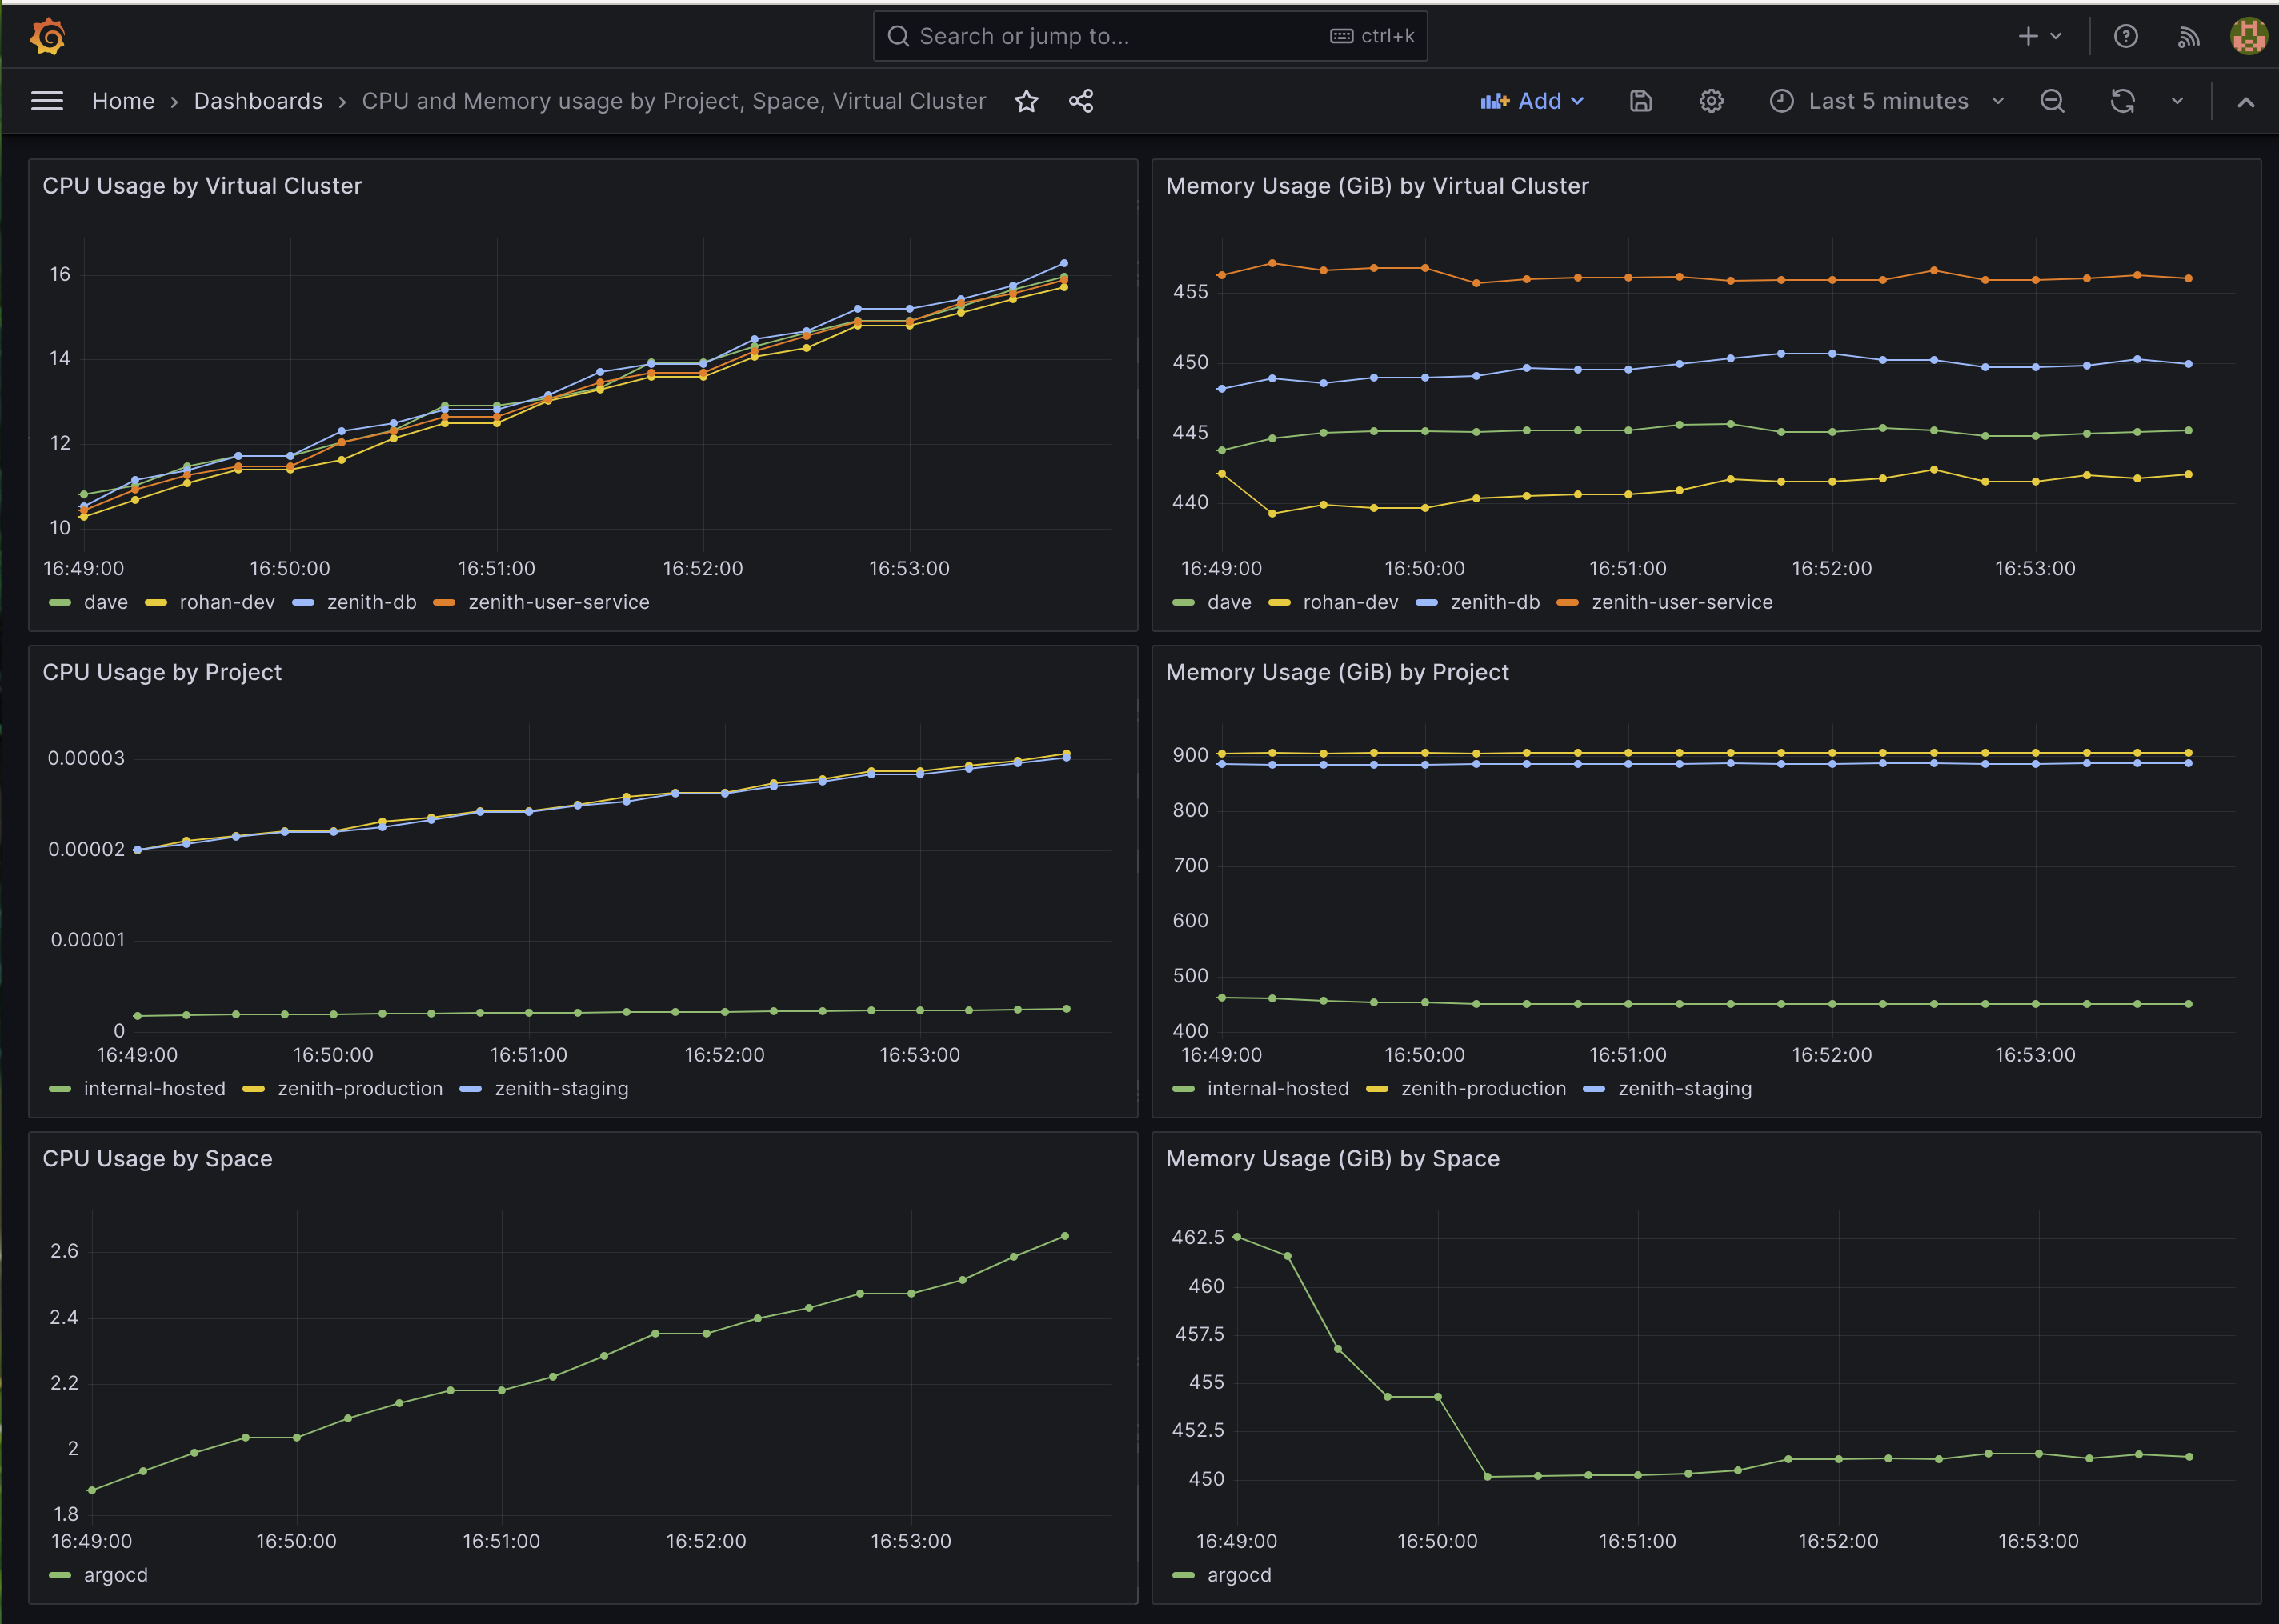
Example dashboard
The Grafana deployment includes a pre-built dashboard that visualizes CPU and Memory usage aggregated by vCluster, Project, and Space.
You can also import additional dashboards or create custom visualizations using the available labels.