How to: Exploring K8S on vCluster, Deploying an Observability stack - part 2

Mar 22, 2026
|
9
min Read
.jpeg)
When you’re building applications on Kubernetes, observability isn’t optional, it’s foundational. You need metrics to know if things are healthy, dashboards to spot trends, alerting to catch problems early, and long-term storage to answer questions about what happened last week or last month.
In this two-part series, we’ll deploy a complete observability stack on a local Kubernetes cluster powered by vCluster. No cloud account required. No VMs.
Just Docker and a few commands.
In our previous edition we built the monitoring stack of our environment, also commonly referred to as the metrics collection component of an Observability stack, but a Observability is the combination of metrics and log, so here we are, lets see whats involved to deploy an Log Analytics based on Elastsearch.
All source code is available at georgelza/Exploring_vCluster_K8s_Observability_2.
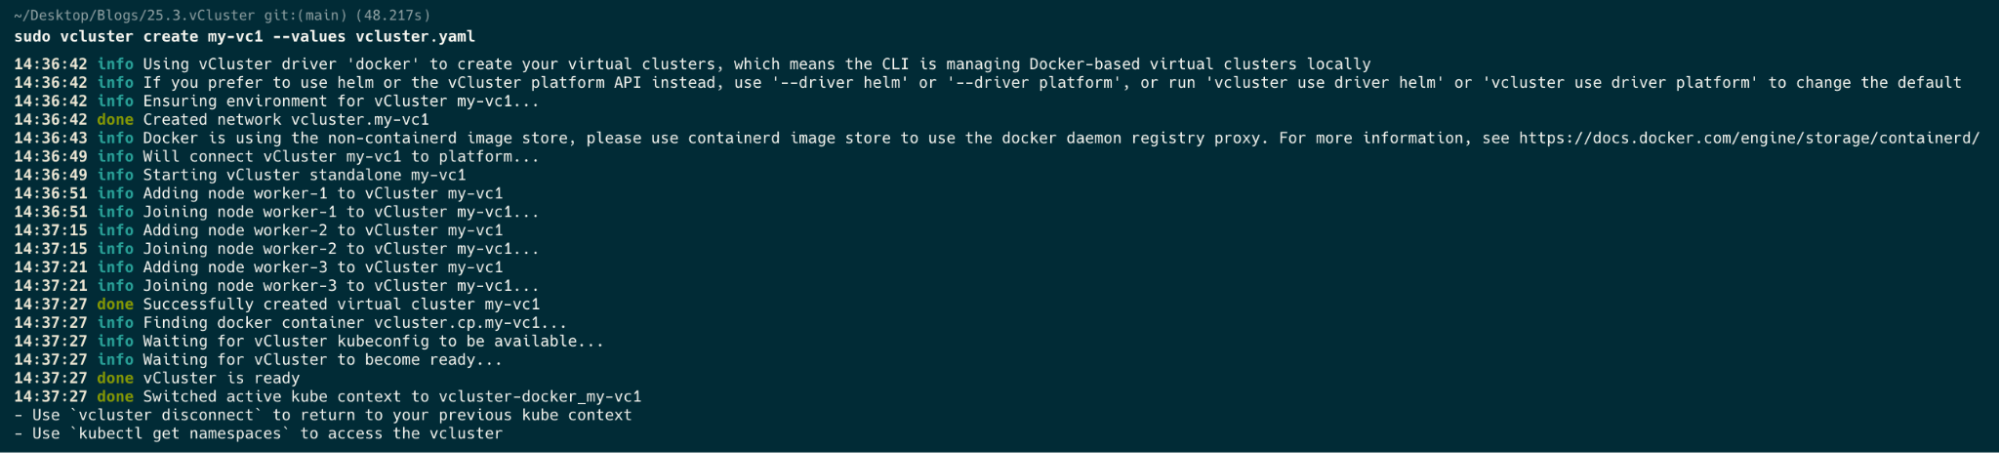
vCluster with the Docker driver gives you a multi-node Kubernetes cluster running entirely in Docker containers. For this project, that means a control plane and three worker nodes enough capacity to run the full observability stack alongside demo workloads all created with a single command:
vcluster create my-vc1 -f vcluster.yaml
The vcluster.yaml configures a 3-worker-node cluster:
controlPlane:
  distro:
    k8s:
      version: "v1.35.0"
experimental:
  docker:
    nodes:
    - name: "worker-1"
    - name: "worker-2"
    - name: "worker-3"
That’s it. In under a minute, you have a fully functional Kubernetes cluster with multiple nodes, ready to host real workloads. When you’re done for the day, vcluster pause my-vc1 frees up resources. vcluster resume my-vc1 picks up right where you left off.
Here’s the full stack:
Note, This is not a ElasticSearch/Kibana/Filebeat How To/Tutorial. As such I will not be going into deep detail about the specific settings and their configurations.
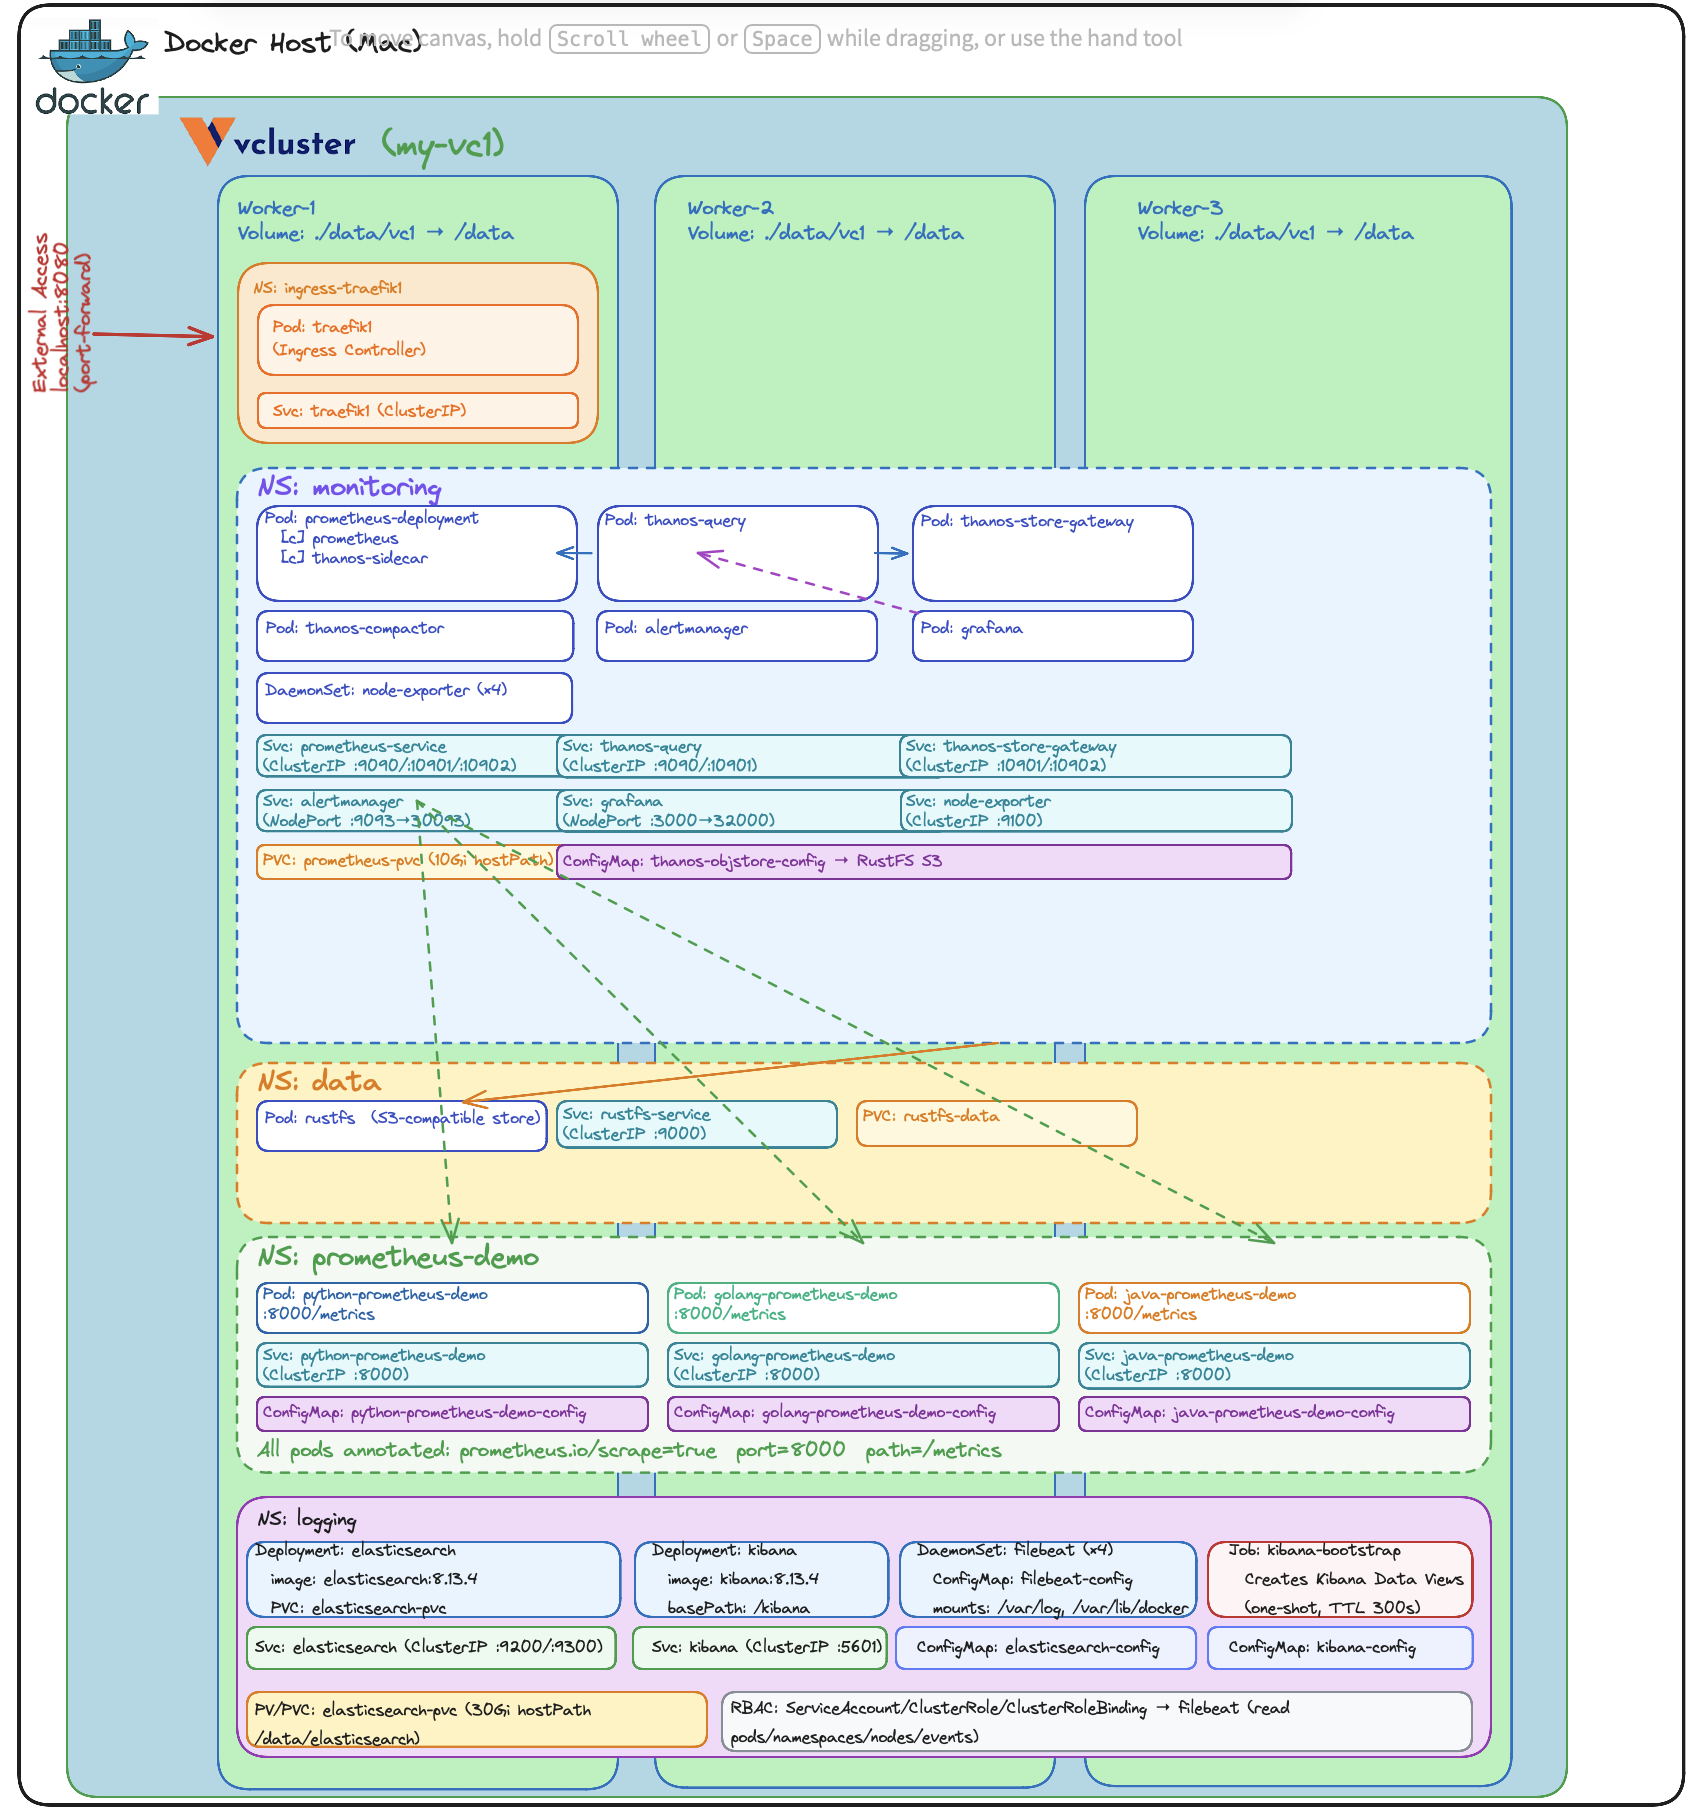
As per the previous edition, the stack includes three applications that generate custom Prometheus metrics — implemented in Python, Java, and Go.
The little surprise, what we did not mention at the time was that these example applications already exposed structured log messages as per below.
{
"app": "python-prometheus-demo",
"module":"main",
"level": "INFO",
"ts": "2025-01-01T10:00:00Z",
"event": "startup",
"sleep_min": 1.0,
"sleep_max": 5.0,
"max_run": "unlimited"
}
The deployment follows a specific order since components depend on each other:
namespaces → elasticsearch → kibana → filebeat → traefik → demo apps
Each component, as per above can be deployed using kubectl apply -f <file name> in the numbered directories found under ./loganalytics. Tear down is accomplished by executing kubectl delete -f <file name> in the reverse order.
For the complete step-by-step walkthrough, see loganalytics/README.md and loganalytics/Deploy_core.md, followed by loganalytics/Deploy_analytics.md
This project is part of a series building up a complete local Kubernetes development environment:
By the end of the series, you have a local environment with application hosting, ingress routing, metrics collection, dashboarding, alerting, long-term metric storage, and log analytics. That’s a genuinely useful development platform — and it all runs on your laptop.
No system should go to production without end-to-end observability. You need metrics and logs working together to understand what’s happening. Log messages tell you what caused the resource usage. It's the insight into the values of the properties of the API calls, of the Database calls.
The deployment has been divided into 2 sections, Core deployment and Log Analytics deployment.
(Note, you can skip the core deployment if you still have it running from the previous blog, the loganalytics fit nicely on what we previously built).
git clone https://github.com/georgelza/Exploring_vCluster_K8s_Observability_2.git
cd loganalytics
First, a screenshot showing what we are starting with:
Docker ps

sudo vcluster create my-vc1 --values vcluster.yaml
Now a docker ps after we’ve created our cluster.
docker ps

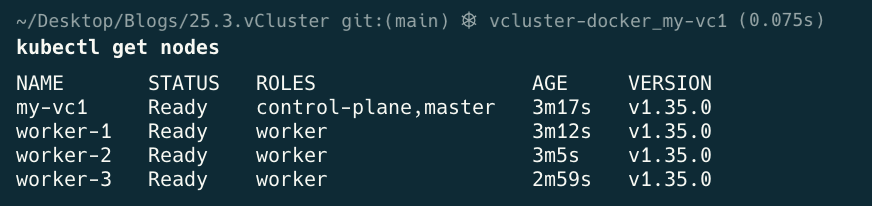
kubectl get nodes

kubectl get namespaces

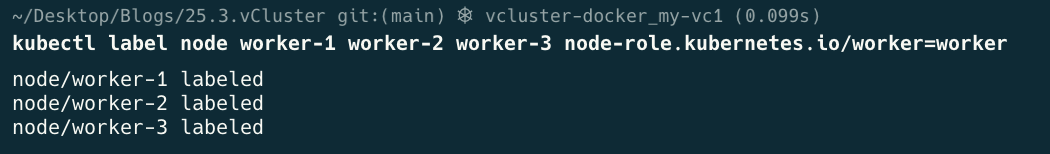
kubectl label node worker-1 worker-2 worker-3 node-role.kubernetes.io/worker=worker
kubectl get nodes
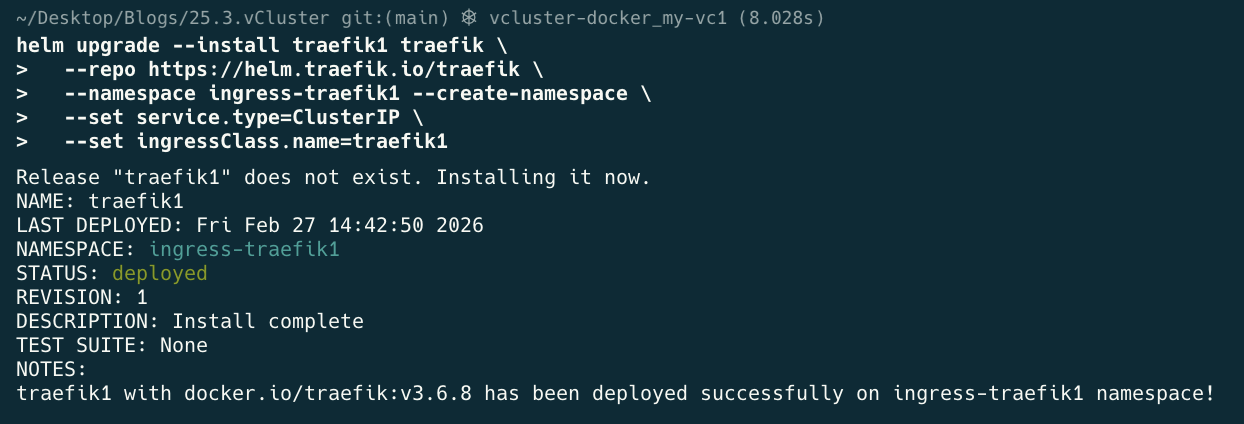
helm upgrade --install traefik1 traefik \
  --repo https://helm.traefik.io/traefik \
  --namespace ingress-traefik1 --create-namespace \
  --set service.type=ClusterIP \
  --set ingressClass.name=traefik1
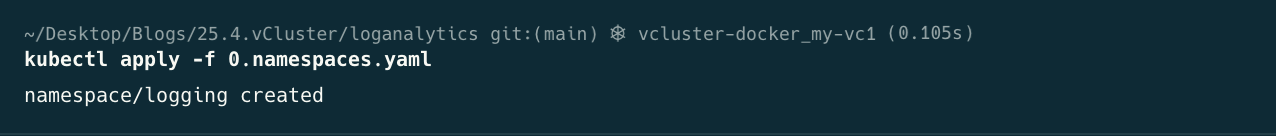
cd loganalytics
kubectl apply -f 0.namespaces.yaml
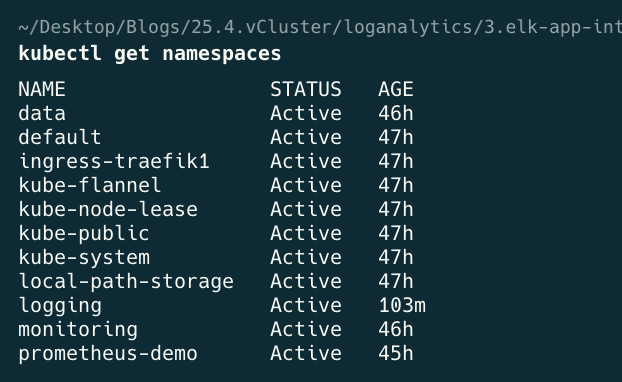
kubectl get namespaces
cd 1.elasticsearch
kubectl apply -f 1.logging-storage.yaml
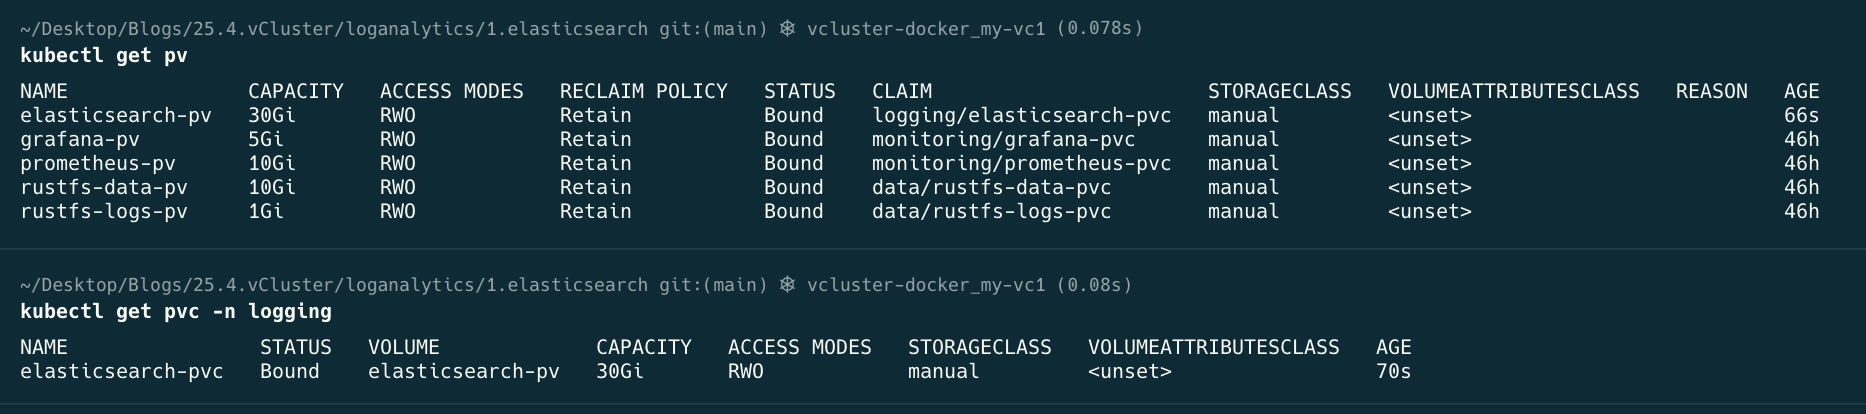
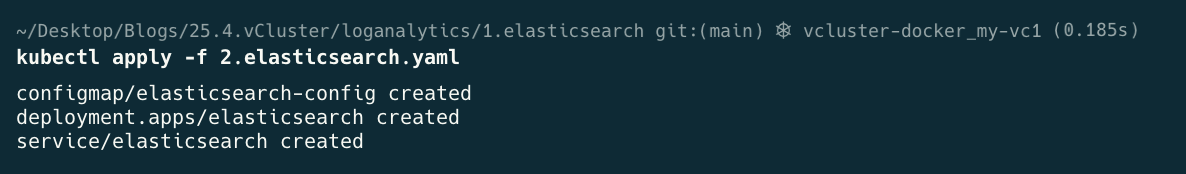
kubectl apply -f 2.elasticsearch.yaml
kubectl get all -n logging
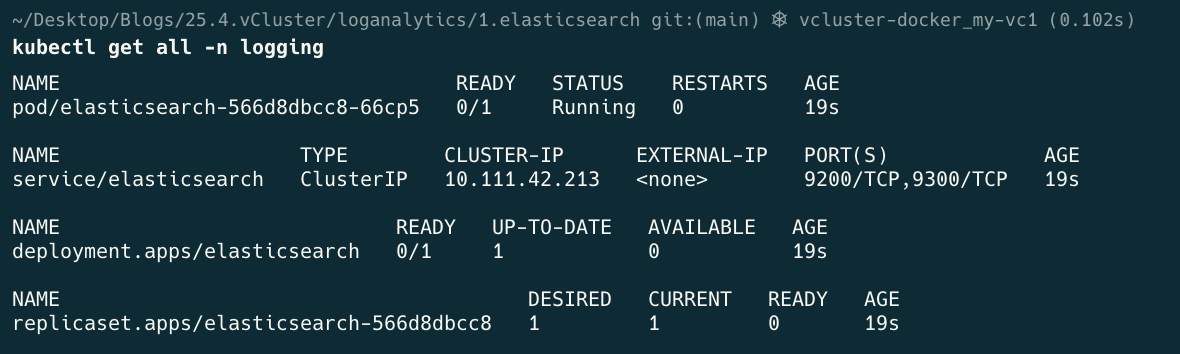
At this point wait till the above has finished deploying, in other words pod/elasticsearch-#### needs to read 1/1 Running before continuing.
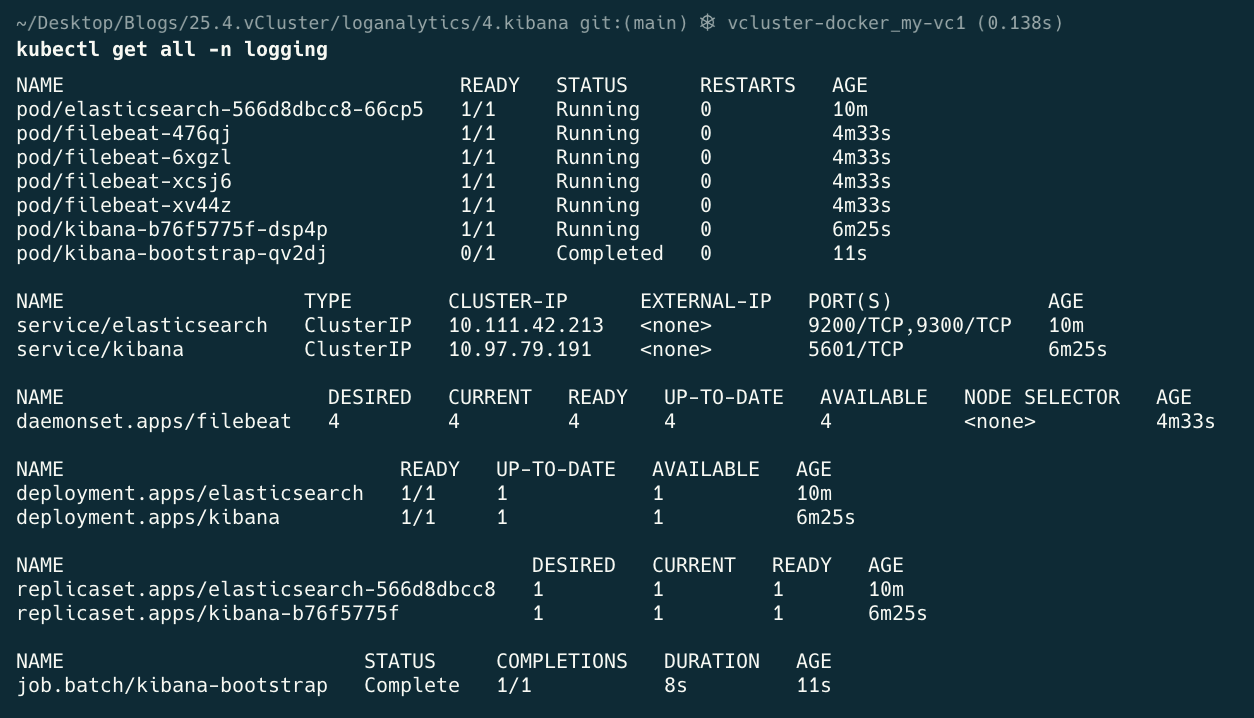
kubectl apply -f 3.kibana.yaml

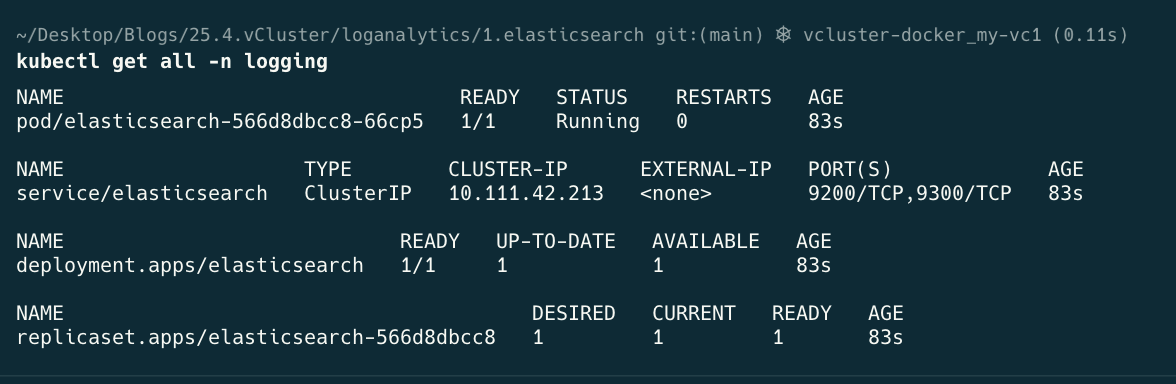
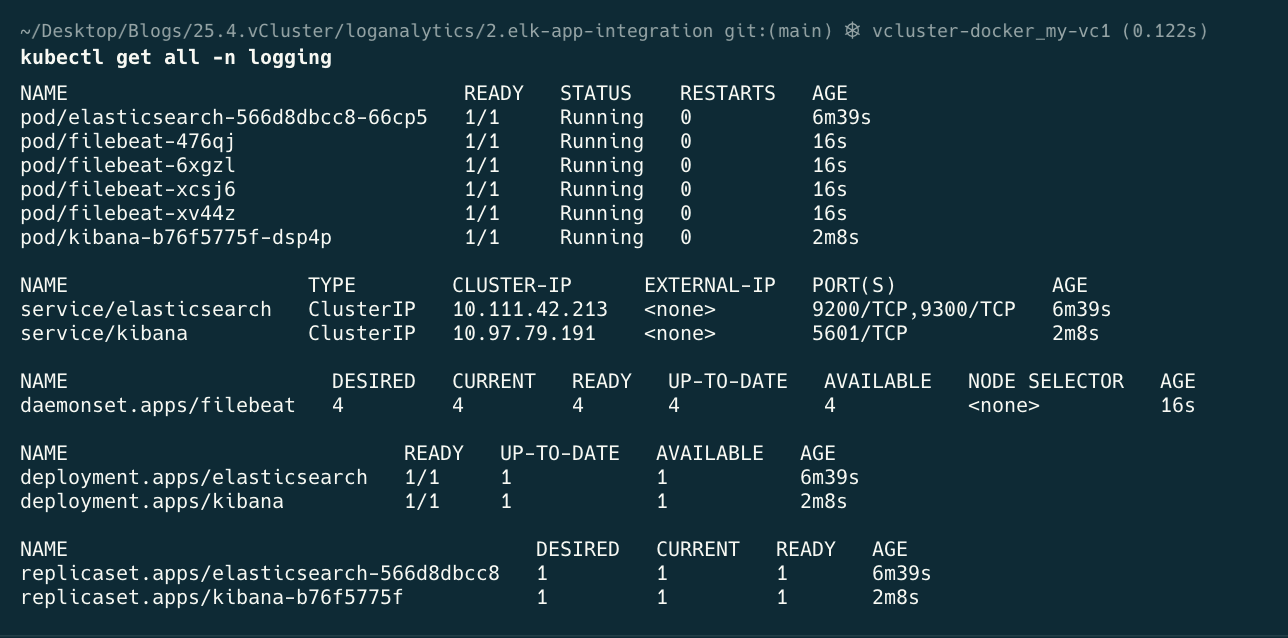
kubectl get all -n logging

cd 2.elk-app-integration
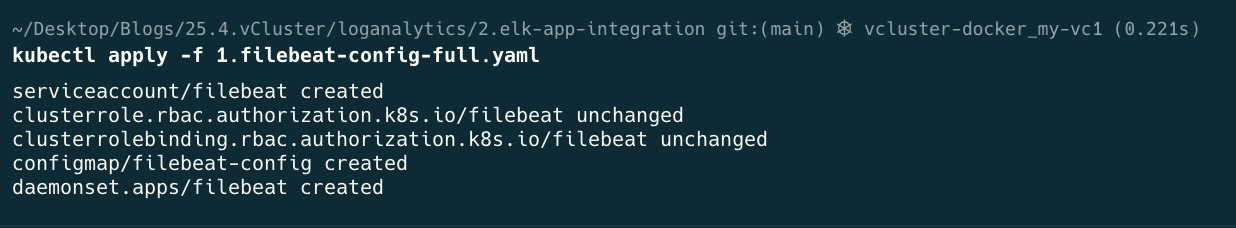
kubectl apply -f 1.filebeat-config-full.yaml
This part of the deployment and the settings in filebeat-config-full.yaml is critical, and took some time to figure out to make sure filebeat read the data correctly and then submitted to elasticsearch correctly,
Pay attention to the contains and the kubnernetes.pod.names, condition / lines 88-90
These define which log entries to include into our output to be tagged using the tag: [“pythong-prometheus-demo”]
- condition:
        contains:
          kubernetes.pod.name: "python-prometheus-demo"
      config:
        - type: container
          paths:
            - /var/log/containers/*${data.kubernetes.container.id}.log
          tags: ["python-prometheus-demo"]
We additionally also have a generic, catch all rule, which catches all log entries that don match our above rule, lines 233-244
# ── Catch-all: every pod NOT matched above ──────────────────────
# Logs land in filebeat-generic-* without JSON parsing.
# This ensures no pod logs are silently dropped.
- condition:
    and:
      - not:
          contains:
            kubernetes.pod.name: "python-prometheus-demo"
Also the 2 specific settings in the output.elasticsearch section, see, line 268-271.
setup.template.enabled: false
setup.ilm.enabled: false
kubectl get all -n logging
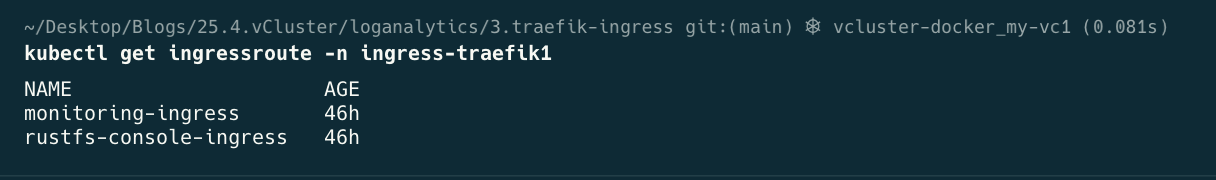
cd 3.traefik-ingress
kubectl apply -f .
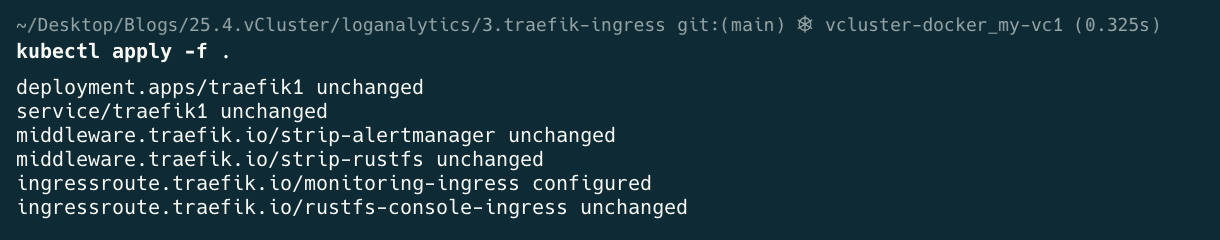
kubectl get ingressroute -n ingress-traefik
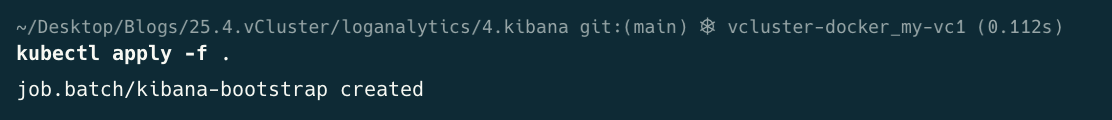
cd 4.kibana
kubectl apply -f .
kubectl get all -n logging
Note, Bootstrap will run, very quickly, change to Completed state and then go into “READY” 0/1.
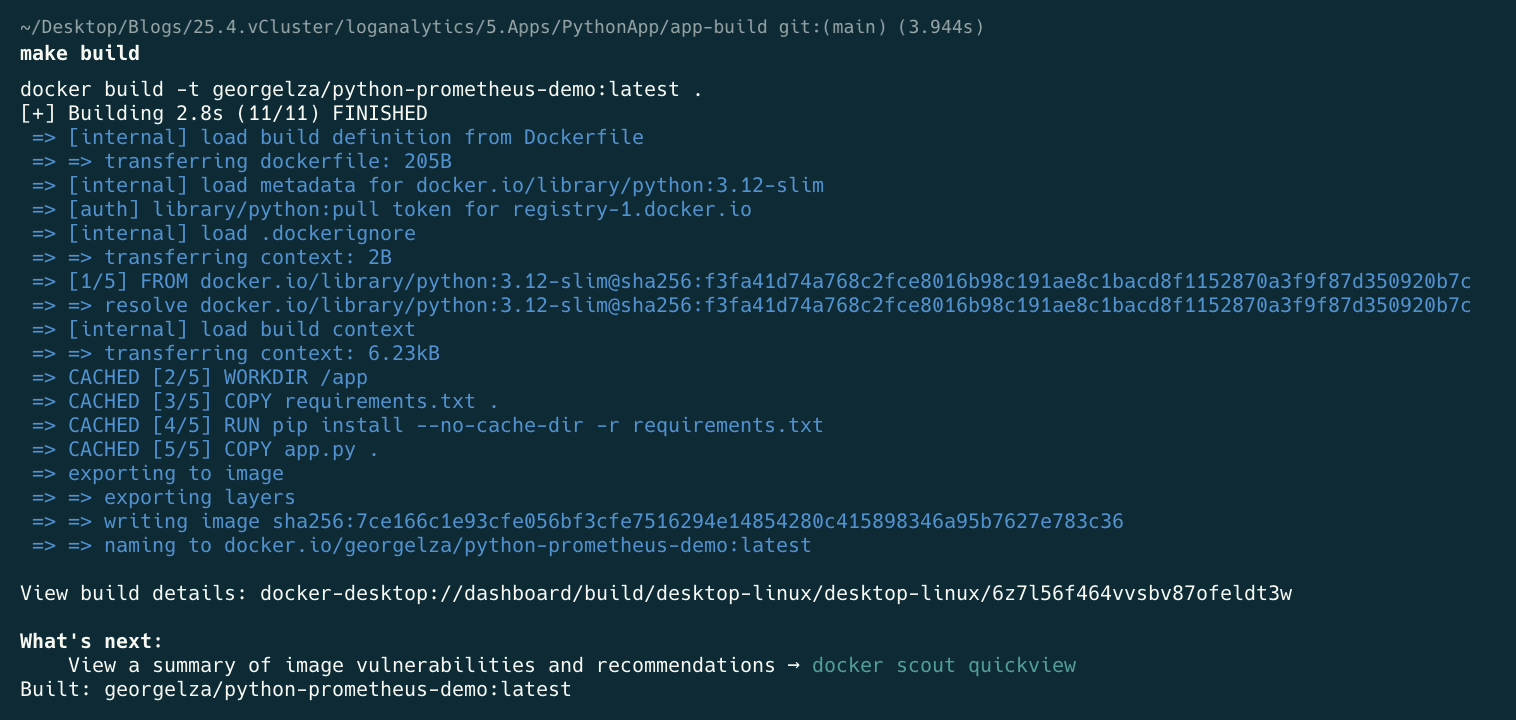
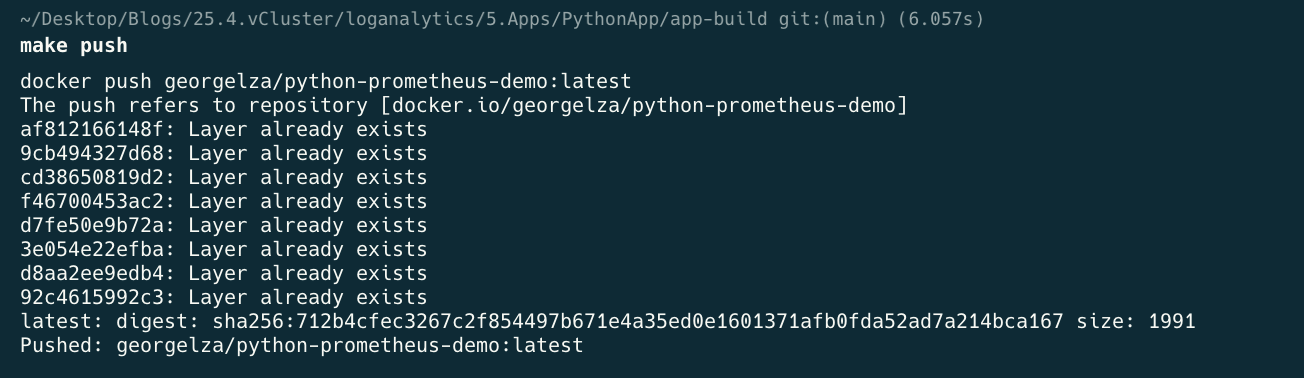
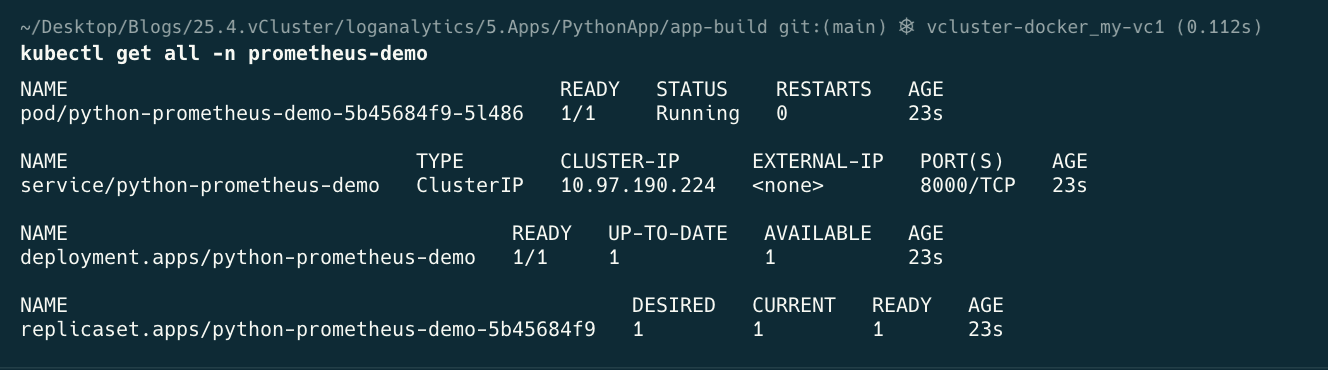
cd 5.Apps/PythonApp/app-build
make build
make push
make k-apply

kubectl get all -n prometheus-demo
kubectl port-forward service/traefik1 -n ingress-traefik1 8080:80
There is a 6.kibana/README.md file which contains multiple steps that can be executed to verify the logs are being shipped from the containers, ingested and indexed by ElasticSearch.
6.kibana/payload.json is an example of the ingested log entry.
See: my-vc1/* for various screengrabs during the deployment process.
The Following are the output of the steps as detailed in 6.kibana/README.md
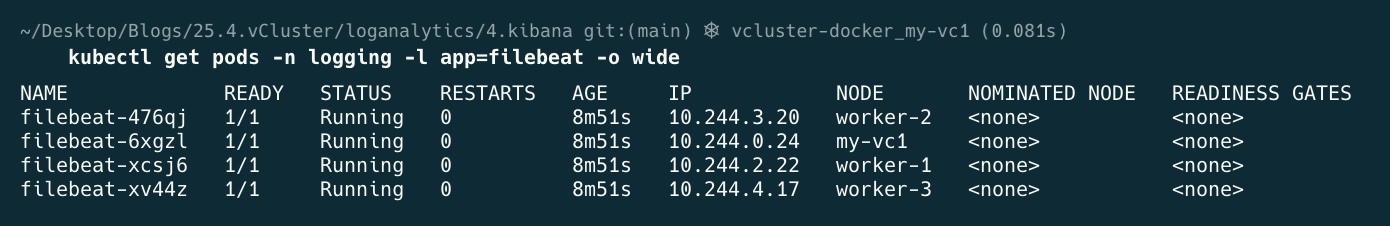
kubectl get pods -n logging -l app=filebeat -o wide
curl -s "http://localhost:9200/_cat/indices?v" | grep python

curl -s “http://localhost:9200/_cat/indexes?v” | grep filebeat

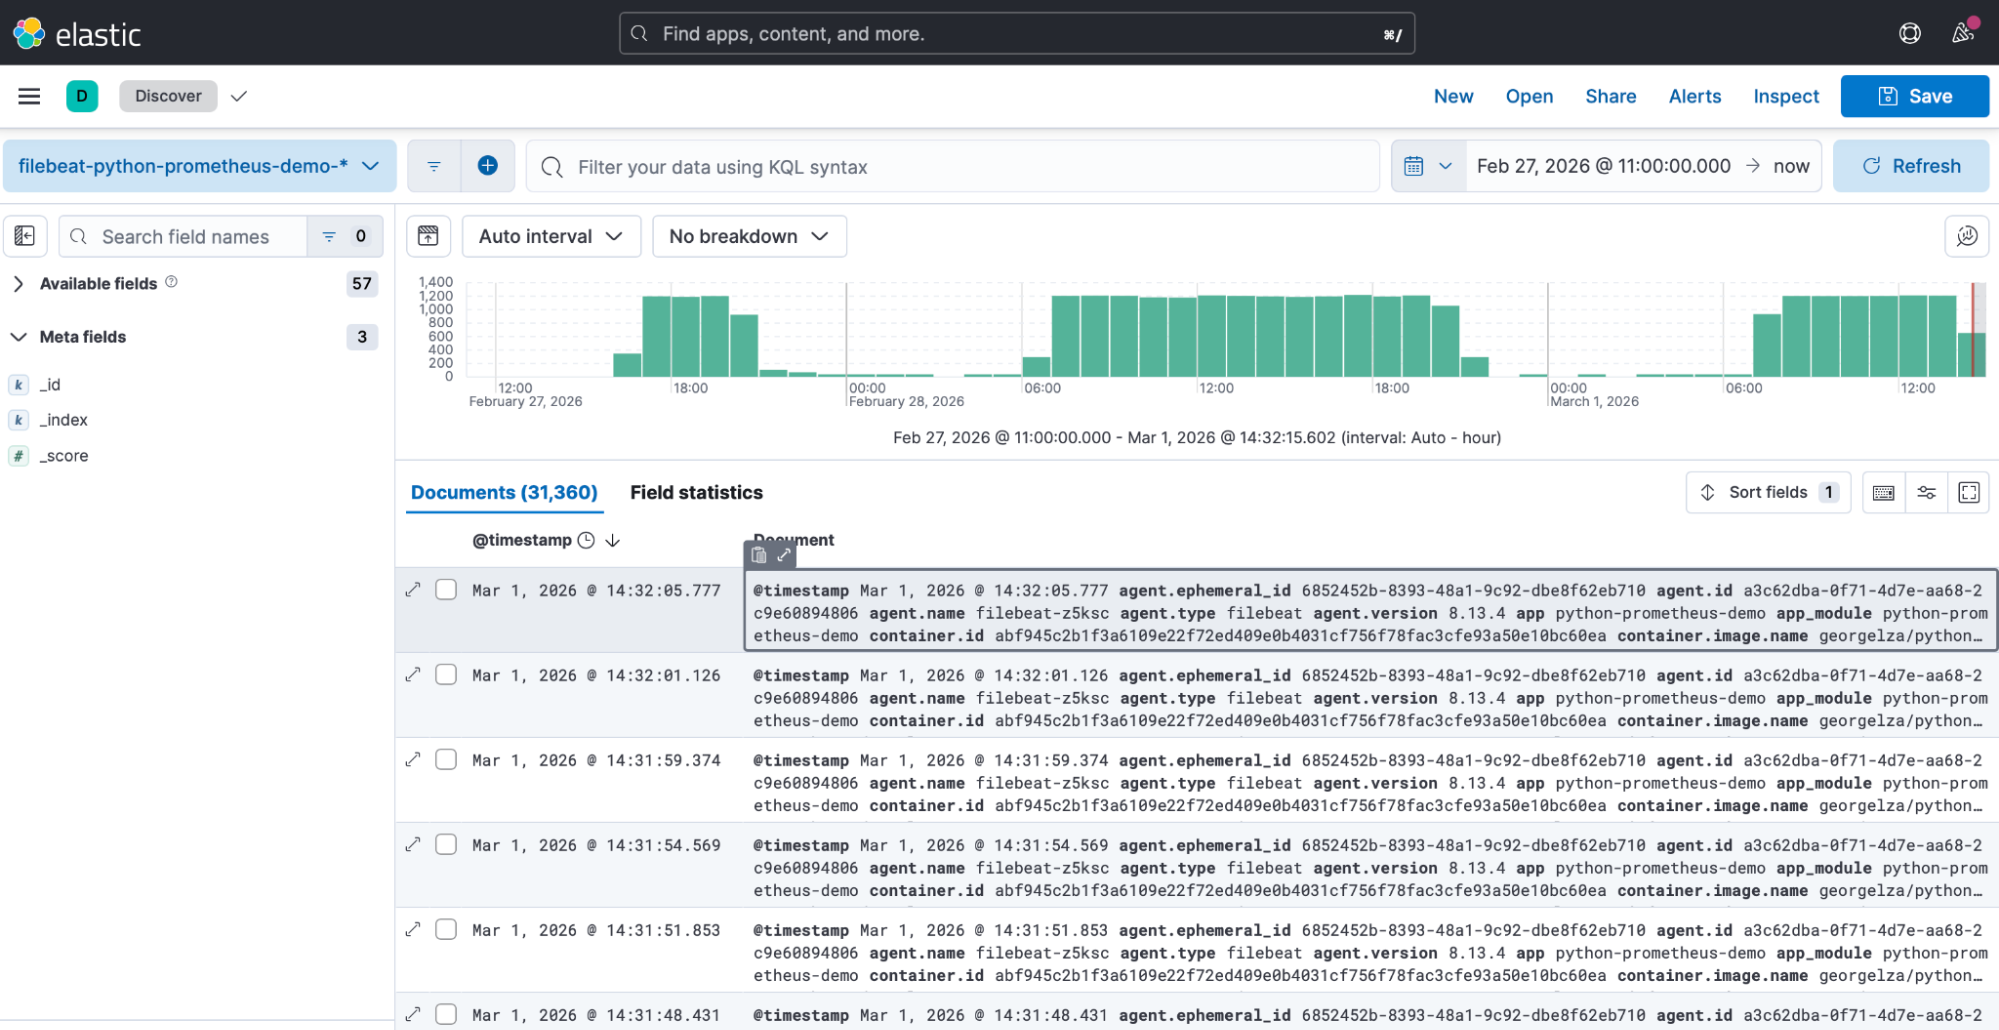
curl -s "http://localhost:9200/filebeat-python-prometheus-demo-*/_search?pretty&size=1" \
  | python3 -m json.tool \
  | grep -E '"@timestamp"|"app_module"|"log.level"|"event.action"|"message"'

curl -s "http://localhost:9200/filebeat-python-prometheus-demo-*/_search?pretty" \
  -H "Content-Type: application/json" \
  -d '{
    "size": 0,
    "aggs": {
      "by_level": {
        "terms": { "field": "log.level.keyword" }
      }
    }
  }' | python3 -m json.tool | grep -A 3 '"buckets"' | grep "key\|doc_count"
The below shows the count of logs ingested per
“key” : “INFO”
“doc_count”=450
If we had more “key”’s then they would have been shown.

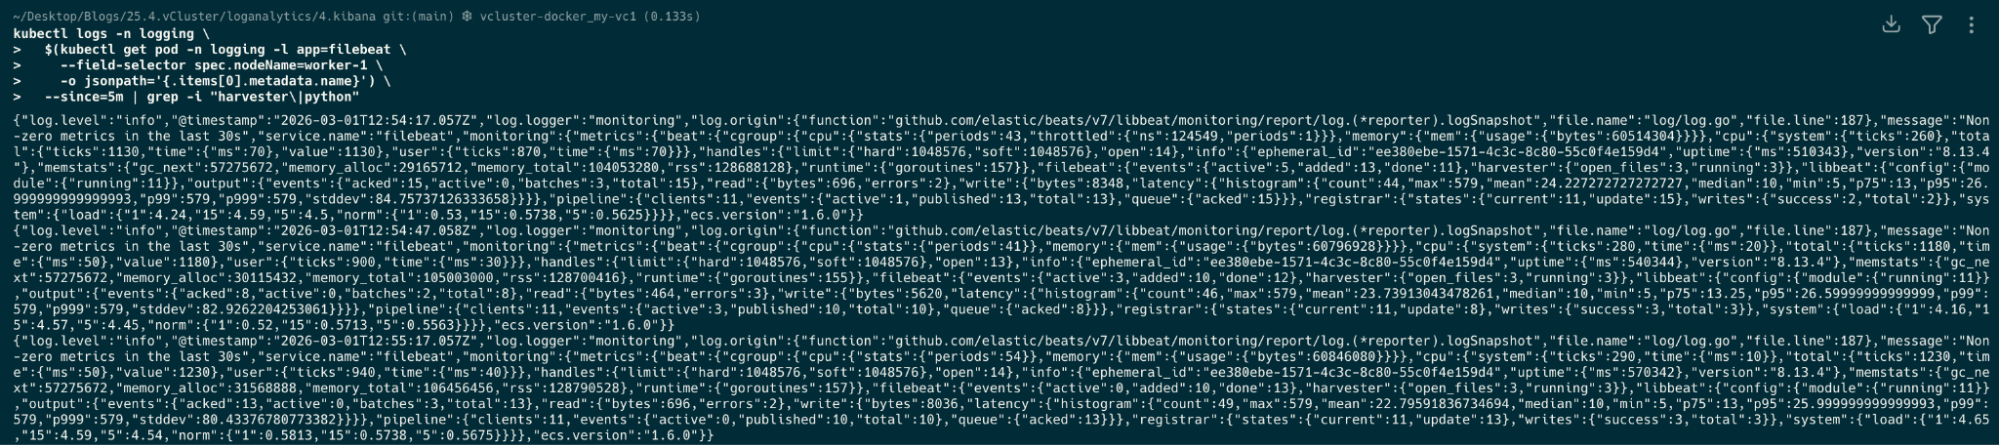
kubectl logs -n logging \
  $(kubectl get pod -n logging -l app=filebeat \
    --field-selector spec.nodeName=worker-1 \
    -o jsonpath='{.items[0].metadata.name}') \
  --since=5m | grep -i "harvester\|python"
Navigate to http://localhost:8080/kibana
Deploy your first virtual cluster today.
