Kubernetes HPA - Is it good to be used as is?

Oct 3, 2024
|
10
min Read
One of the most powerful features of Kubernetes is its ability to automatically scale components based on workload demands. This autoscaling capability includes several tools, such as the Horizontal Pod Autoscaler (HPA), Vertical Pod Autoscaler (VPA), and Cluster Autoscaler.
In this tutorial, we’ll focus on the Horizontal Pod Autoscaler (HPA), which automatically adjusts the number of pod replicas based on CPU and memory usage.
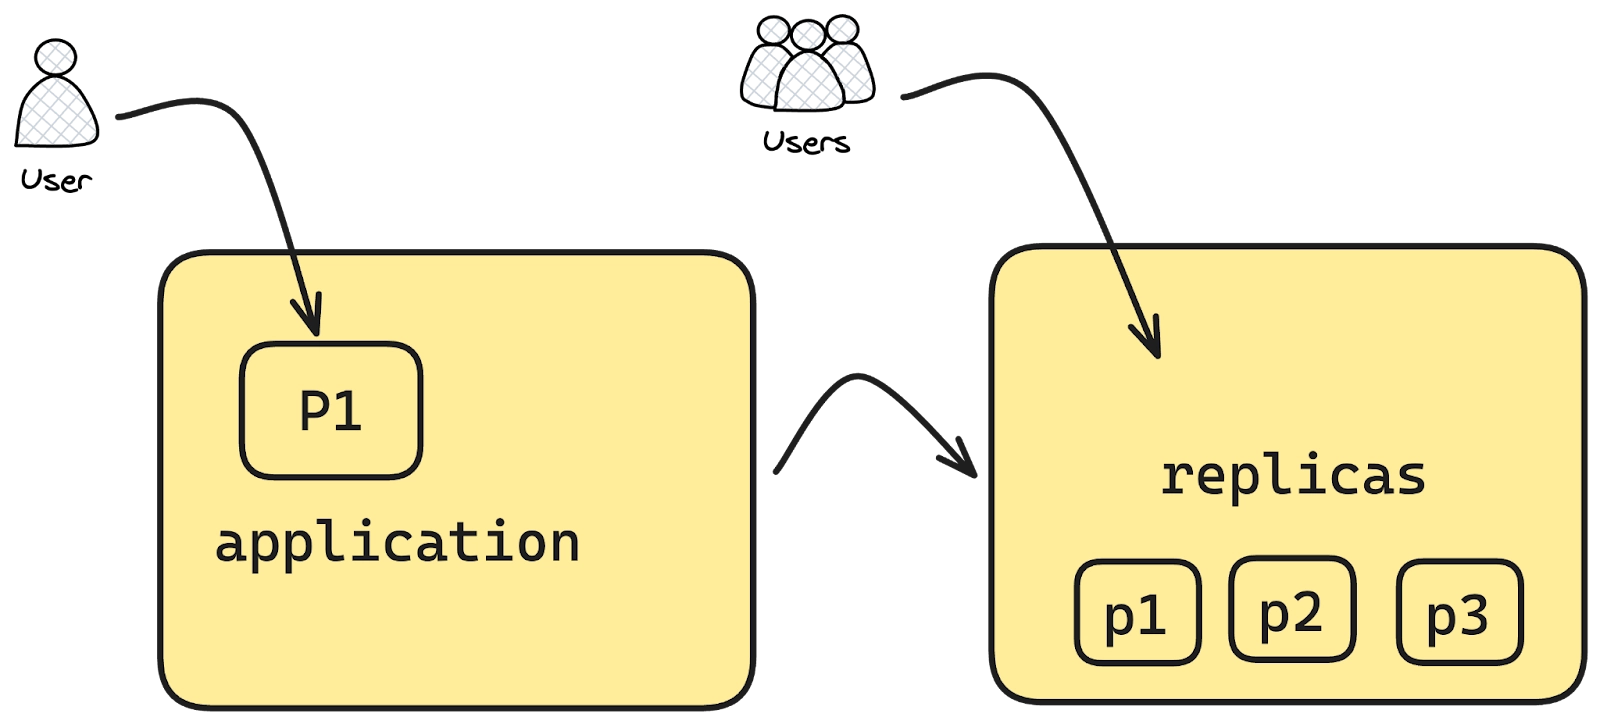
Imagine you’ve deployed an application to your Kubernetes cluster as a deployment, specifying a certain number of replicas. These replicas represent the pods running across your nodes. While you can estimate the number of pods needed, sudden surges in traffic, like during holiday sales or special events, can overwhelm your system, leading to manual intervention to scale the replicas.
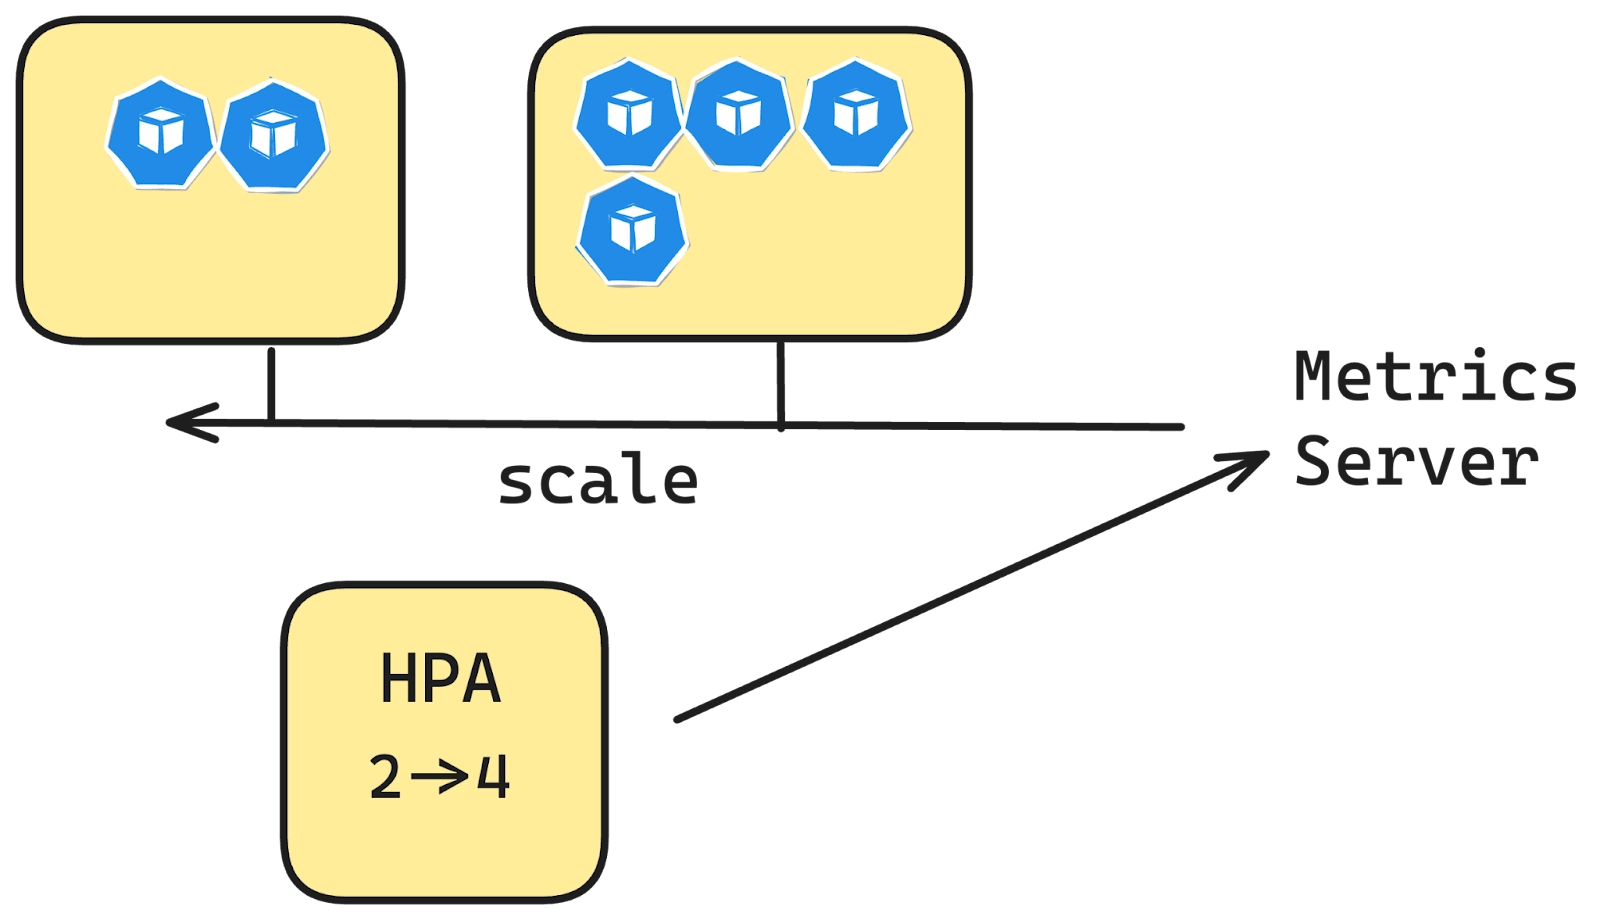
This is where Kubernetes’ HPA comes in. Instead of manually adjusting the replica count, HPA monitors the resource usage of your pods and automatically scales them up or down based on the load. When traffic spikes, HPA increases the number of replicas to meet the demand, and when traffic decreases, it scales down to the minimum required pods—helping you manage resource utilization efficiently without any manual effort.
desiredReplicas = ceil[currentReplicas * ( currentMetricValue / desiredMetricValue )]
Command:
kubectl get nodes
Output:
NAME                   STATUS   ROLES    AGE   VERSION
demo-cluster-bvmm3   Ready    <none>   17d   v1.30.4
demo-cluster-bvmm8   Ready    <none>   17d   v1.30.4
demo-cluster-bvmmu   Ready    <none>   17d   v1.30.4
Command:
kubectl apply -f
https://github.com/kubernetes-sigs/metrics-server/releases/latest/download/components.yaml
Output:
serviceaccount/metrics-server created
clusterrole.rbac.authorization.k8s.io/system:aggregated-metrics-reader created
clusterrole.rbac.authorization.k8s.io/system:metrics-server created
rolebinding.rbac.authorization.k8s.io/metrics-server-auth-reader created
clusterrolebinding.rbac.authorization.k8s.io/metrics-server:system:auth-delegator created
clusterrolebinding.rbac.authorization.k8s.io/system:metrics-server created
service/metrics-server created
deployment.apps/metrics-server created
apiservice.apiregistration.k8s.io/v1beta1.metrics.k8s.io created
Let’s create a simple nginx deployment onto the Kubernetes cluster.
apiVersion: apps/v1
kind: Deployment
metadata:
  name: nginx-deployment
  labels:
    app: nginx
spec:
  replicas: 1
  selector:
    matchLabels:
      app: nginx
  template:
    metadata:
      labels:
        app: nginx
    spec:
      containers:
      - name: nginx
        image: nginx:1.21
        ports:
        - containerPort: 80
        resources:
          requests:
            cpu: "100m"
          limits:
            cpu: "500m"
Let’s expose the deployment as a NodePort service.
Command:
kubectl expose deployment nginx-deployment --type=NodePort --name=nginx-serv
Now, let’s create HPA file
apiVersion: autoscaling/v2
kind: HorizontalPodAutoscaler
metadata:
  name: nginx-hpa
spec:
  scaleTargetRef:
    apiVersion: apps/v1
    kind: Deployment
    name: nginx-deployment
  minReplicas: 1
  maxReplicas: 5
  metrics:
  - type: Resource
    resource:
      name: cpu
      target:
        type: Utilization
        averageUtilization: 50
This HPA will monitor the CPU utilisation of the nginx-deployment. If the average CPU utilisation across the pods exceeds 50%, it will increase the number of pod replicas up to a maximum of 5. If utilisation drops below 50%, it can reduce the replicas, but never below 1. The HPA dynamically adjusts the number of pods to optimise resource usage and application performance based on CPU metrics.
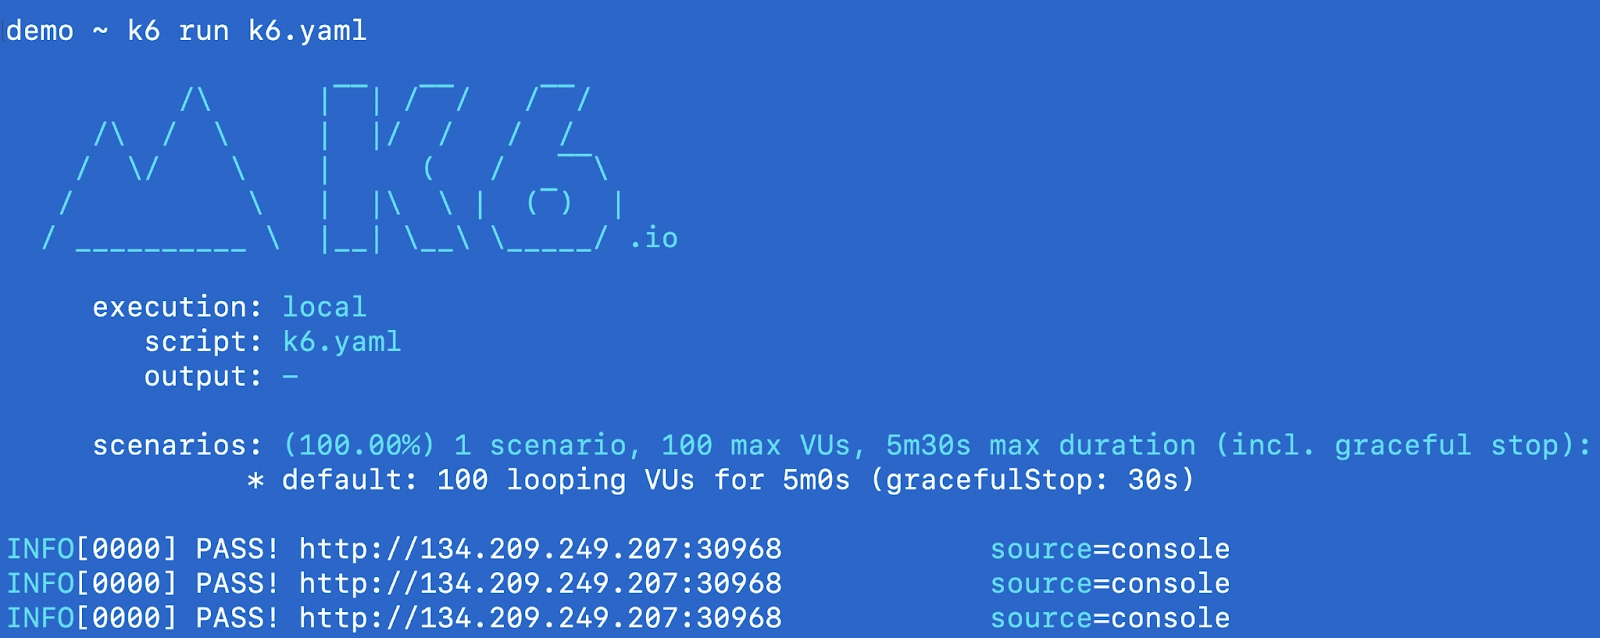
How can we test this and see if this is working? You can use any load testing tools and try calling the service that we created to keep hitting the nginx pod running. In this case let’s use k6.
K6 is an open source extensible load testing tool built for developer happiness by Grafana Labs. In this case, we just write a simple test in javascript and then do the load testing to see if the HPA we deployed works as expected.
import http from "k6/http";
import { check } from "k6";

export const options = {
  vus: 100,
  duration: '5m', // Increase duration to observe scaling
};

const BASE_URL = 'http://134.209.249.207:30968'; // Replace with your NodePort service address

function demo() {
  const url = `${BASE_URL}`;

  let resp = http.get(url);

  check(resp, {
    'endpoint was successful': (resp) => {
      if (resp.status === 200) {
        console.log(`PASS! ${url}`)
        return true
      } else {
        console.error(`FAIL! status-code: ${resp.status}`)
        return false
      }
    }
  });
}

export default function () {
  demo();
}
The only thing you would need to modify in the above script is the BASE_URL as this will be your nodeIP and the nodeport.
So, let's get the nodeIP and the NodePort of the nginx-service.
Command:
kubectl get nodes -o jsonpath='{.items[0].status.addresses[?(@.type=="ExternalIP")].address}'; echo -n ":"; kubectl get svc nginx-service -o jsonpath='{.spec.ports[0].nodePort}'
Output:
134.209.249.207:30968
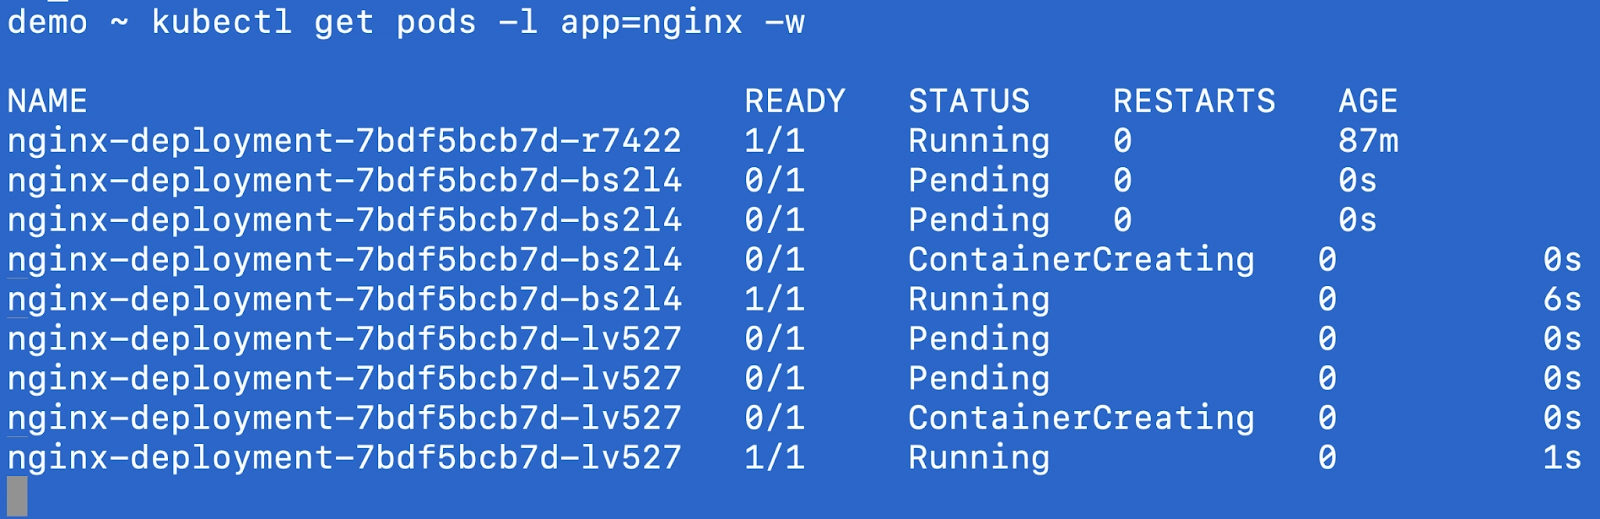
In another tab, you will be able to see the pods starting to create based on the HPA configuration as the load starts to increase.
You can also get hpa and see the number of replicas increasing as per the load.
kubectl get hpa -w
NAME        REFERENCE                     TARGETS        MINPODS   MAXPODS   REPLICAS   AGE
nginx-hpa   Deployment/nginx-deployment   cpu: 44%/50%   1         5         3          90m
nginx-hpa   Deployment/nginx-deployment   cpu: 50%/50%   1         5         3          91m
nginx-hpa   Deployment/nginx-deployment   cpu: 72%/50%   1         5         3          91m
nginx-hpa   Deployment/nginx-deployment   cpu: 64%/50%   1         5         5          91m
There is another way to create the HPA configuration using the imperative method by using the kubectl CLI itself and not creating the YAML file.
The kubectl autoscale command equivalent to above YAML that we created would be
kubectl autoscale deployment nginx-deployment --cpu-percent=50 --min=1 --max=5
This command scales the nginx-deployment based on CPU utilisation, targeting an average of 50% CPU usage, with a minimum of 1 replica and a maximum of 5 replicas.
apiVersion: autoscaling/v2
kind: HorizontalPodAutoscaler
metadata:
  name: my-app-container-hpa
spec:
  scaleTargetRef:
    apiVersion: apps/v1
    kind: Deployment
    name: my-app-deployment
  minReplicas: 2
  maxReplicas: 10
  metrics:
  - type: ContainerResource
    containerResource:
      name: cpu
      container: application
      target:
        type: Utilization
        averageUtilization: 60
Above specifies that the HPA should only monitor the CPU usage of the application container in each pod, and it will scale based on an average CPU utilisation of 60%. This approach is useful when you have multiple containers in a pod but want to scale the deployment based on the resource utilisation of a particular container (e.g., a web server) and ignore others (e.g., a sidecar container).
2. Stabilization window : Due to the dynamic nature there can be rapid scaling up and down (known as "flapping"), HPA uses a stabilization window, allowing time for the system to stabilise before making further adjustments.
behavior:
  scaleDown:
    stabilizationWindowSeconds: 300
3. Scaling policies: For HPE you can define behaviours for granular controls on how many pods should be scaled up over a period of time and same for scaledown. You can define a behaviour field in the yaml.
behavior:
  scaleDown:
    policies:
    - type: Pods
      value: 4
      periodSeconds: 60
    - type: Percent
      value: 10
      periodSeconds: 60
For above, there are two policies, first one says that the max scaleDown that can happen is 4 pods in the period of 60 seconds and second one says when the scale down is happening ad the number of replicas are more like 80+ then 10% meaning 8 pods if 80 are there will be scaled down over the period of 60 seconds.
Now that we’ve covered what HPA is and how it operates based on specific metrics, the question remains: is it sufficient for all types of production workloads? Here are a few considerations:
HPA - the horizontal pod autoscaler in Kubernetes lets you scale your workloads based on CPU and memory utilizations. With some of the advanced features you can go a little further in defining scaling policies, custom metrics and stabilisation window. Overall it's a good solution for stateless applications but it is not a suitable fit for all applications running on your Kubernetes cluster.
In future articles we will discuss more auto scaling concepts like VPA, Cluster autoscaler, KEDA and also a very interesting feature that vCluster provides - SLEEP MODE.
In order to get started with virtual Kubernetes clusters check out the open source project - vCluster and also make sure to join slack channel if you have any queries. Let us know what autoscaling strategies you are using in conjunction.
Deploy your first virtual cluster today.
