Stop Running a Prometheus per Tenant: A Practical Guide to Fleet Observability with vCluster Platform v4.11

Aug 27, 2026
|
17
min Read

Observability becomes harder when the question shifts from "Is this cluster healthy?" to "Is the fleet healthy?" Running a complete monitoring stack in every tenant cluster creates duplicated infrastructure, while scraping every cluster from one central system expands the network and credential surface.
With the release of vCluster Platform v4.11, Fleet Observability introduces a centralized, tenant-aware approach to collecting and querying metrics across the fleet. In this post, you will build the complete metrics pipeline on GKE, from a fresh project to a Grafana dashboard displaying metrics from a real workload. You will configure the shared backend, observability gateway, Argo CD integration, edge collectors, scoped authentication, and validation steps. A follow-up post will extend this foundation to GPU health, utilization, and failure signals.
The stack that answers "Is this cluster healthy?" is well understood: Prometheus for metrics storage, an operator to manage it, Grafana for visualization, and persistent storage for retention. The problem is that this setup produces a separate answer for every cluster, while platform teams usually need to ask questions across the entire fleet.
Run that stack in every tenant cluster, and the arithmetic becomes uncomfortable quickly. Fifty tenant clusters with a modest 20 GiB of retention each require a terabyte of storage. That also means fifty Prometheus operators to upgrade, fifty Grafana instances to maintain, and fifty sets of credentials to manage.
When someone asks which tenants experienced elevated pod restarts last Tuesday, there is no single place to find the answer:
Ask a question → open 50 Grafana instances → reconcile 50 answers → hope none have drifted
A common alternative is to point one central Prometheus instance at every tenant cluster and scrape inward. However, this makes every tenant cluster a target that the central system must reach and authenticate to. As the fleet grows, so does the network and credential surface.
Fleet Observability reverses that direction. Collection remains distributed, while ingestion, storage, and querying are centralized:
50 collectors → one authenticated gateway → one backend → one dashboard
Metrics are still collected inside each tenant cluster. After collection, they are pushed through a platform-managed gateway into a shared backend. Each writer is scoped to a specific project and tenant cluster, and the gateway applies trusted platform labels before forwarding the metrics. This gives platform teams a unified fleet view while preserving tenant-scoped access.
Centralize when any of these are true:
Skip it when you run a single cluster, or when tenants genuinely own their own observability and you have no fleet-level responsibility. For everything else, centralize collection first and build dashboards second.
Four moving parts, and each one has a single job:
The following diagram shows how write and query traffic moves between collectors, the gateway, the metrics backend, and Grafana.
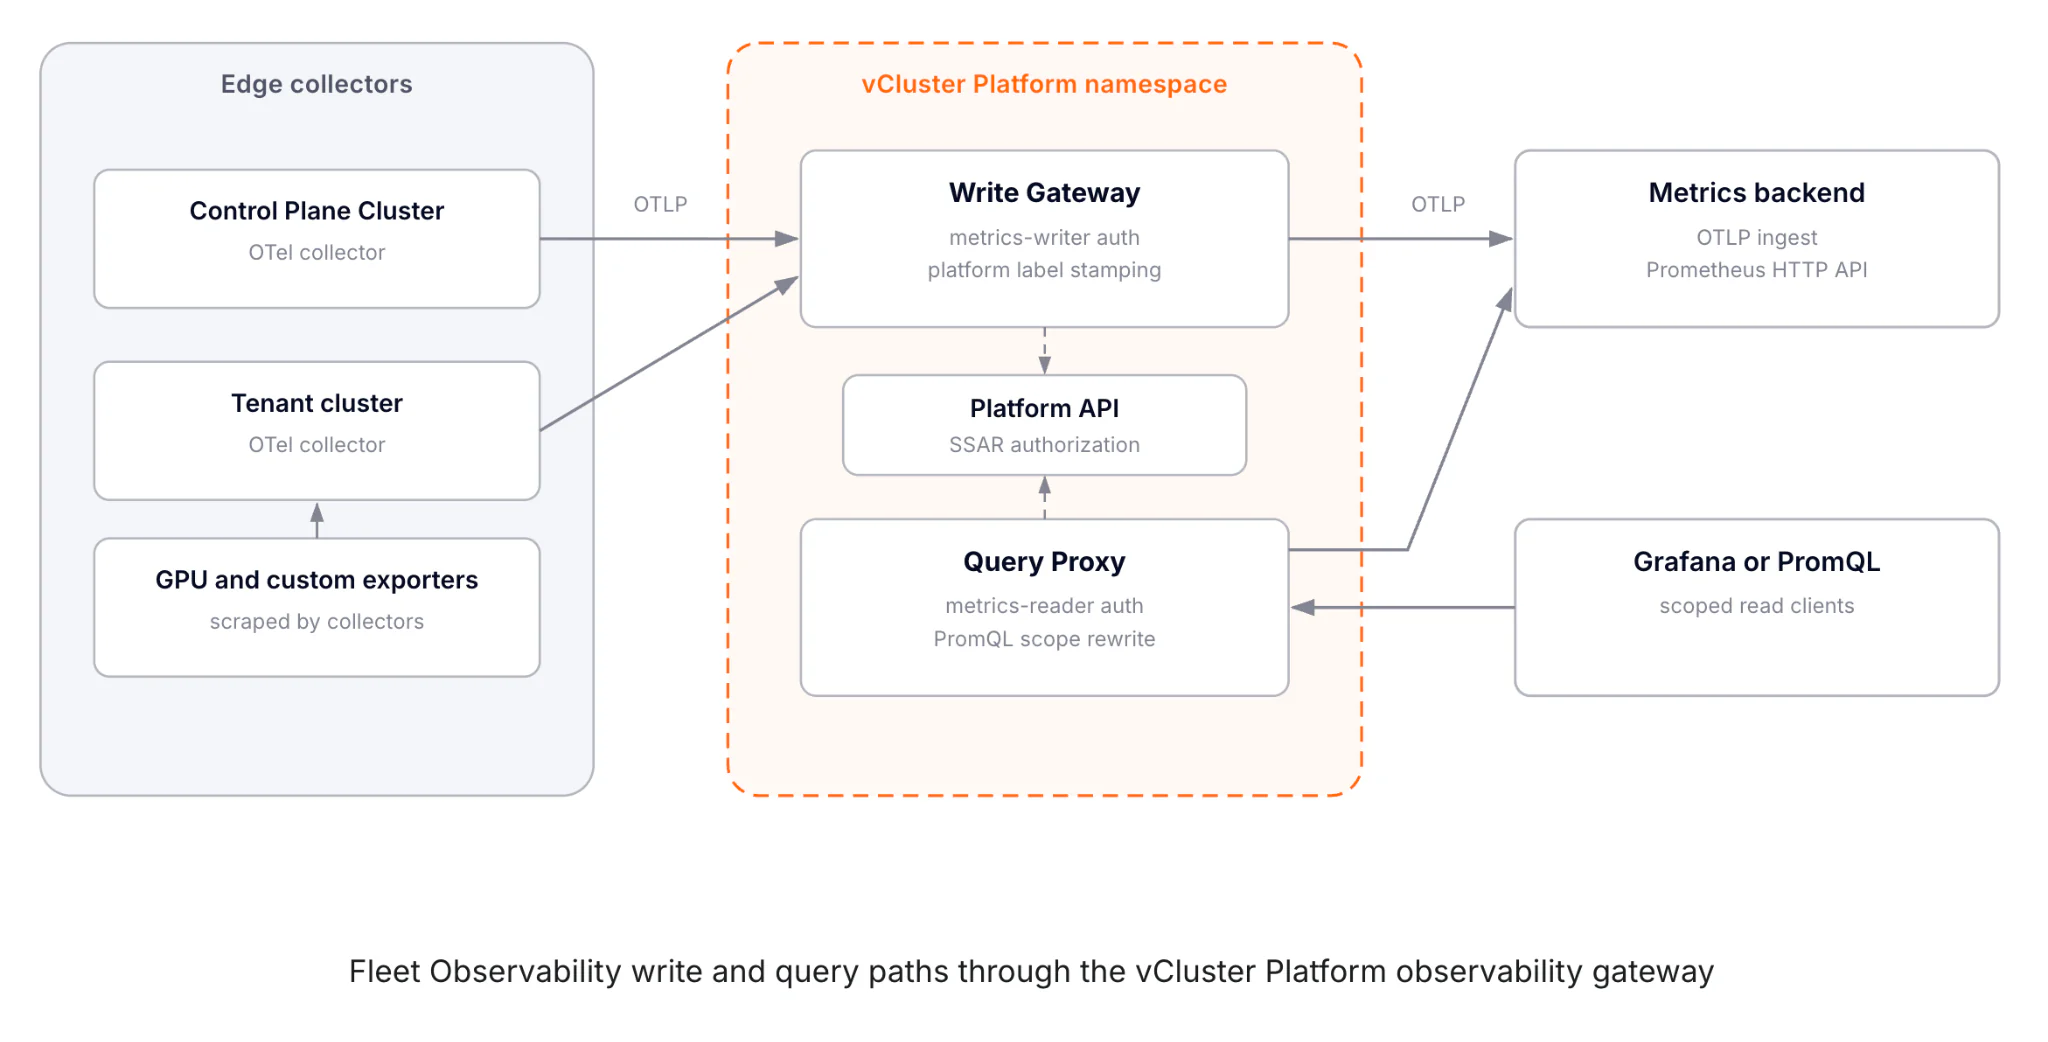
The shared backend, gateway, and Grafana run on the Control Plane Cluster. Collectors run inside tenant clusters, while their deployment is managed from the Control Plane Cluster through Argo CD. This separates tenant-side collection from the central credentials and configuration used by the platform team:
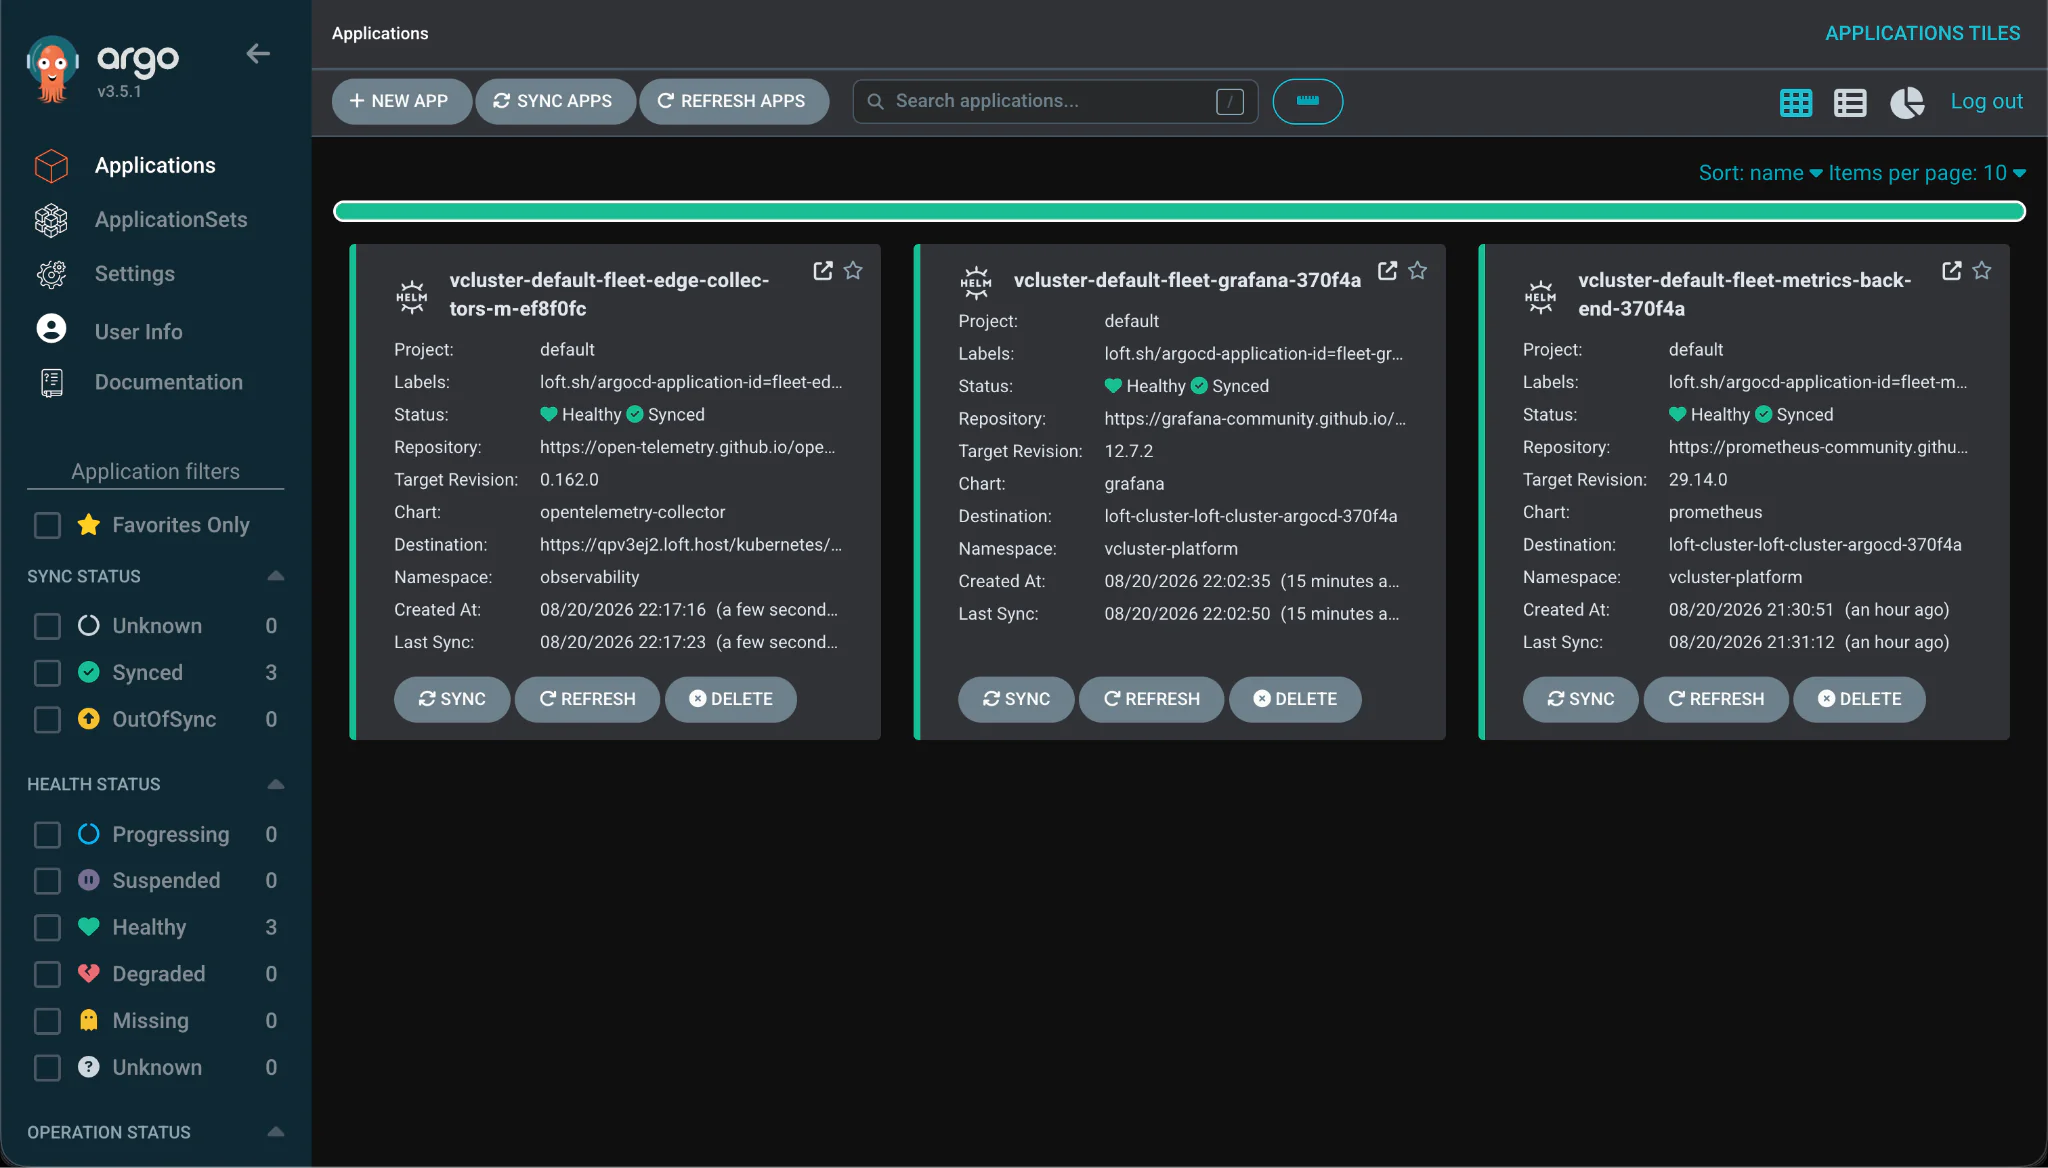
Figure 2: Argo CD applications for the Fleet Observability backend, Grafana, and collector components.
For this walkthrough we will stand up a Control Plane Cluster on GKE, install vCluster Platform and Argo CD on it, and then create a single tenant cluster that ships metrics into the shared backend.
The architectural point is the direction of each path. Metrics flow from the tenant cluster to the gateway. Observability applications flow from the Control Plane Cluster to the tenant cluster through Argo CD. The tenant metrics path does not require an inbound scrape endpoint, while Platform remains the authority for connector configuration and access scope.
Create the cluster first, because Platform, Argo CD, and every tenant control plane will live on it:
gcloud beta container --project "hrittik-project" clusters create "cluster-1" \
  --zone "us-central1-a" \
  --cluster-version "1.35.6-gke.1641000" \
  --release-channel "regular" \
  --machine-type "e2-standard-8" \
  --num-nodes "2" \
  --disk-size "100" \
  --enable-ip-alias \
  --enable-ip-access \
  --enable-managed-prometheus \
  --logging=SYSTEM,WORKLOAD \
  --monitoring=SYSTEM,STORAGE,HPA,POD,DAEMONSET,DEPLOYMENT,STATEFULSET,CADVISOR,KUBELET,JOBSET \
  --addons HorizontalPodAutoscaling,HttpLoadBalancing,NodeLocalDNS,GcePersistentDiskCsiDriver \
  --enable-autoupgrade --enable-autorepair \
  --enable-shielded-nodes --shielded-integrity-monitoring --no-shielded-secure-boot \
  --node-locations "us-central1-a"
With the cluster up, start Platform on it:
vcluster platform start
This installs Platform into the cluster and prints the host used to access it. The same host is added to the Grafana configuration later so that links and Platform integration resolve correctly.
You can also use https://vcluster.cloud!
Fleet Observability delivers its components as Platform-managed Argo CD applications, so Argo CD goes in before anything else:
kubectl create namespace argocd
kubectl apply -n argocd --server-side --force-conflicts \
  -f https://raw.githubusercontent.com/argoproj/argo-cd/stable/manifests/install.yaml
Next, expose the API server and read out the credentials:
kubectl patch svc argocd-server -n argocd -p '{"spec": {"type": "LoadBalancer"}}'

kubectl get svc argocd-server -n argocd \
  -o=jsonpath='{.status.loadBalancer.ingress[0].ip}'

argocd admin initial-password -n argocd
Those two commands give you the two values the connector is built from: the external IP that Argo CD's API server now answers on, and the initial admin password that Argo CD generated during install. Both go into the connector Secret below, so keep them where you can copy them.
A connector in Platform is a plain Secret with a recognized label. Platform watches for loft.sh/connector-type: argocd, reads the credentials inside, and uses them to talk to Argo CD on your behalf:
apiVersion: v1
kind: Secret
metadata:
  name: argocd-main
  namespace: loft
  labels:
    loft.sh/connector-type: argocd
type: Opaque
stringData:
  server: "https://<argocd-loadbalancer-ip>"
  username: "admin"
  password: "<argocd-password>"
  namespace: "argocd"
  insecure: "false"
insecure: This field controls TLS certificate verification for the Argo CD connection. A fresh Argo CD installation uses a self-signed certificate, which does not validate against a raw load balancer IP. For a temporary walkthrough, insecure: "true" allows the connector to proceed. For a persistent environment, configure a trusted certificate and keep insecure: "false".
Now enable the connector on the cluster and let Platform make the connection:
kubectl patch clusters.management.loft.sh loft-cluster \
  --type merge \
  -p '{"spec":{"argoCD":{"enabled":true,"connector":"argocd-main"}}}'
You can also check the integration status in the Platform UI:
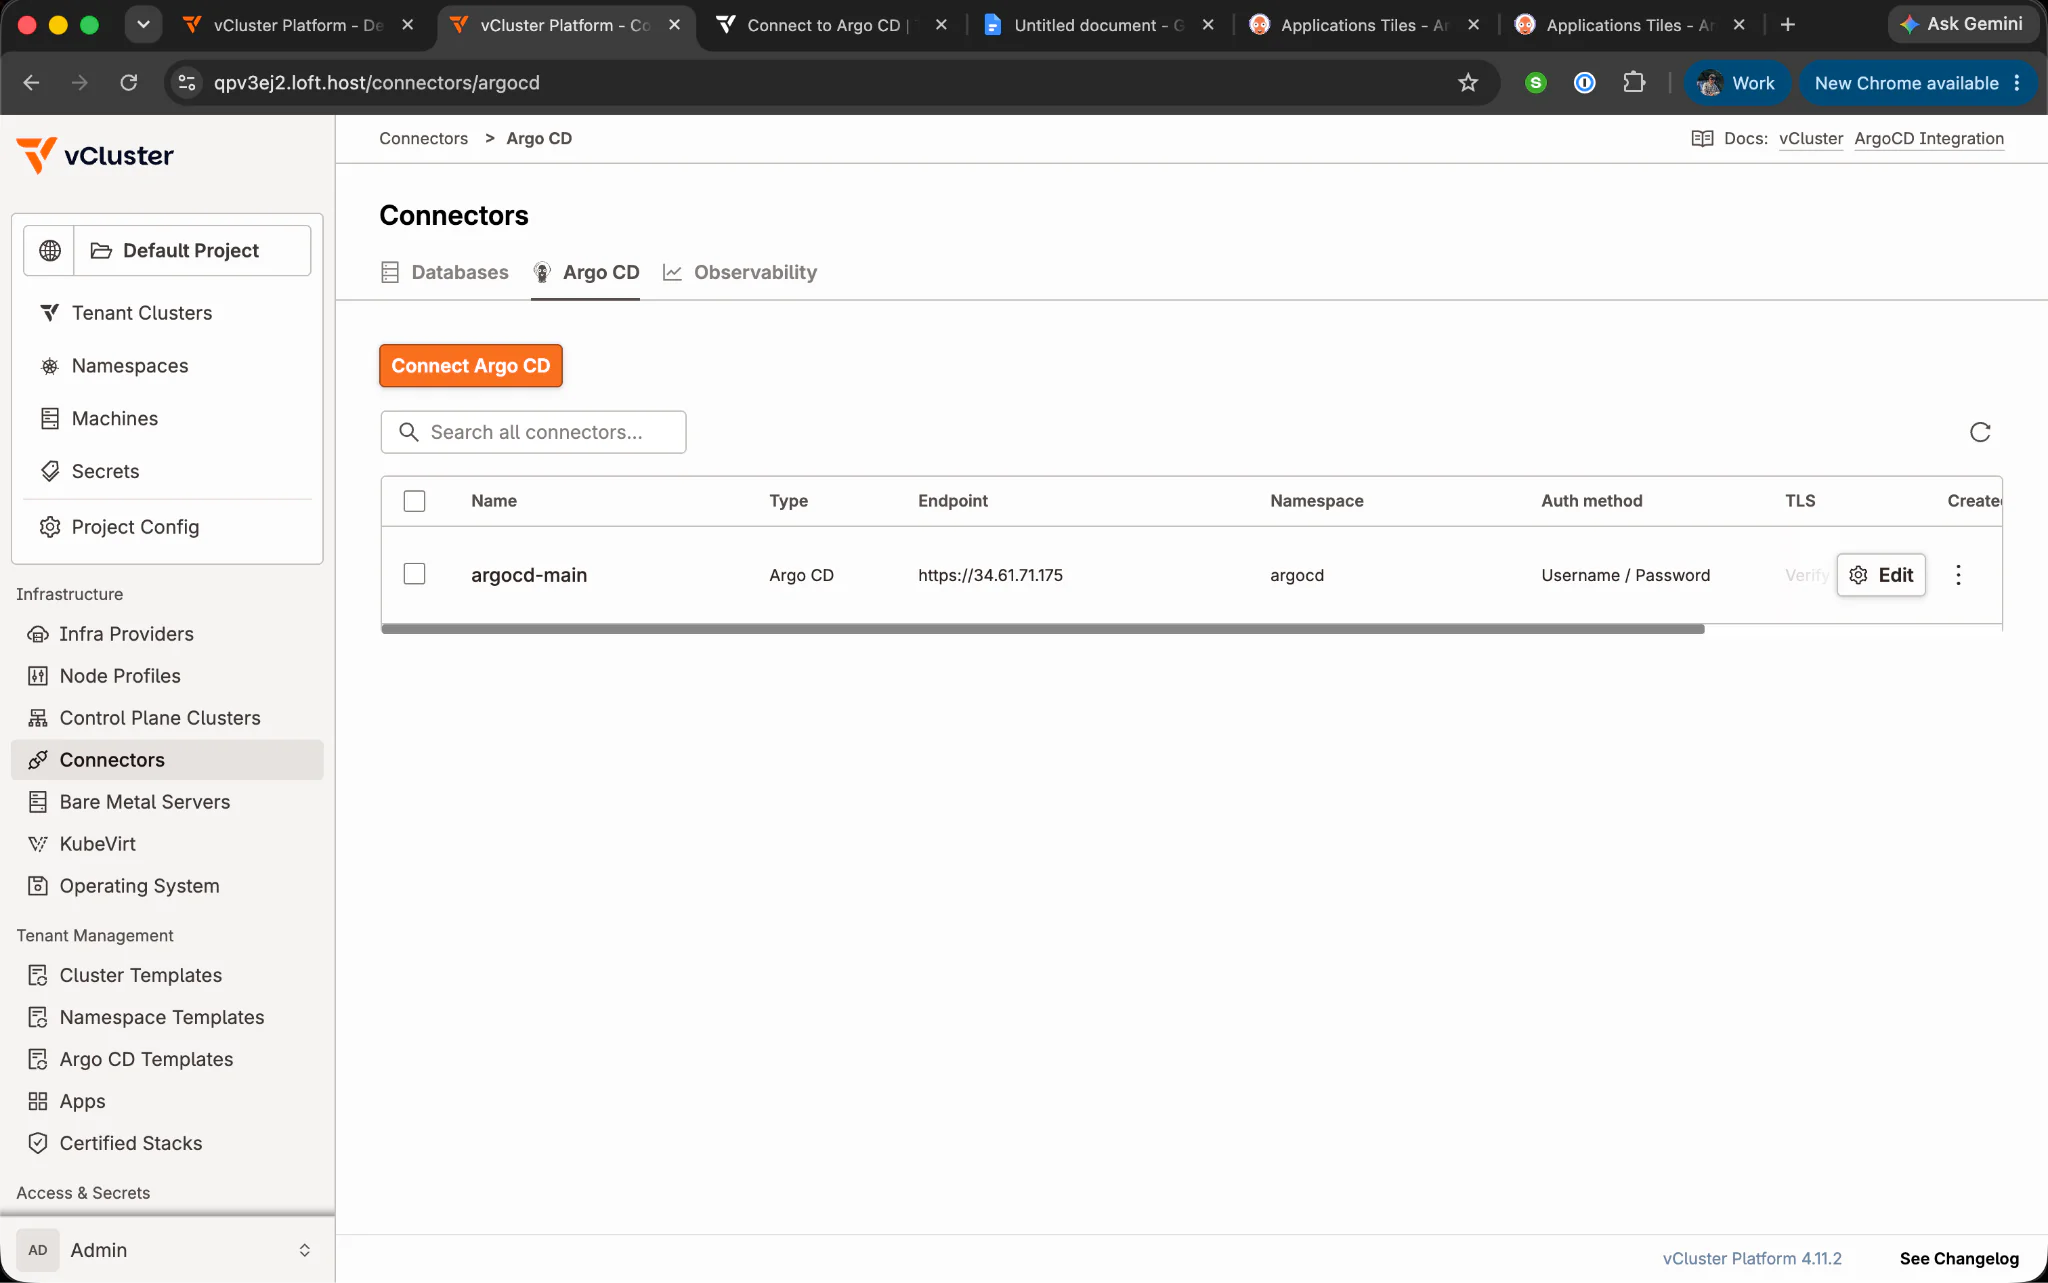
Figure 3: The Argo CD connector configured in vCluster Platform.
The integration status can also be verified with kubectl. This check confirms that Argo CD is ready before the remaining applications are created:
kubectl get clusters.management.loft.sh loft-cluster \
  -o jsonpath='{range .status.conditions[?(@.type=="ArgoCDIntegrationSynced")]}{.status}{" "}{.reason}{" "}{.message}{"\n"}{end}'
Output:
True
The expected value for ArgoCDIntegrationSynced is True. Any other value indicates that the integration is not ready and should be resolved before creating the remaining applications. Platform can accept those resources even when Argo CD is not yet able to deploy them.
With the integration live, the metrics backend is a single resource. Platform ships the template, you supply the parameters, and Argo CD performs the install:
apiVersion: management.loft.sh/v1
kind: ArgoCDApplication
metadata:
  name: fleet-metrics-backend
  namespace: p-default # replace with your project namespace
spec:
  displayName: "Fleet metrics backend"
  destination:
    cluster:
      name: loft-cluster # reserved name for Platform's local cluster, do not change
  templateRef:
    name: fleet-observability-prometheus
  parameters:
    destinationNamespace: vcluster-platform
    prometheusStorageSize: 20Gi
    project: default
destination.cluster.name: loft-cluster. This reserved name refers to the cluster where Platform is running, rather than the underlying GKE cluster name. The value therefore remains loft-cluster for this deployment.
destinationNamespace: vcluster-platform. The gateway looks for the backend's mTLS certificate Secret in the namespace it shares with it, and the connector Secret in the next step addresses the backend by a Service DNS name that includes this namespace.
prometheusStorageSize: 20Gi. This is fleet-wide retention, not per-tenant, so size it against how many tenant clusters you expect and how long you want to keep their metrics.
$ kubectl apply -f fleet-metrics-backend.yaml
argocdapplication.management.loft.sh/fleet-metrics-backend created
The Argo CD application view provides a second confirmation that the metrics backend has been deployed successfully.
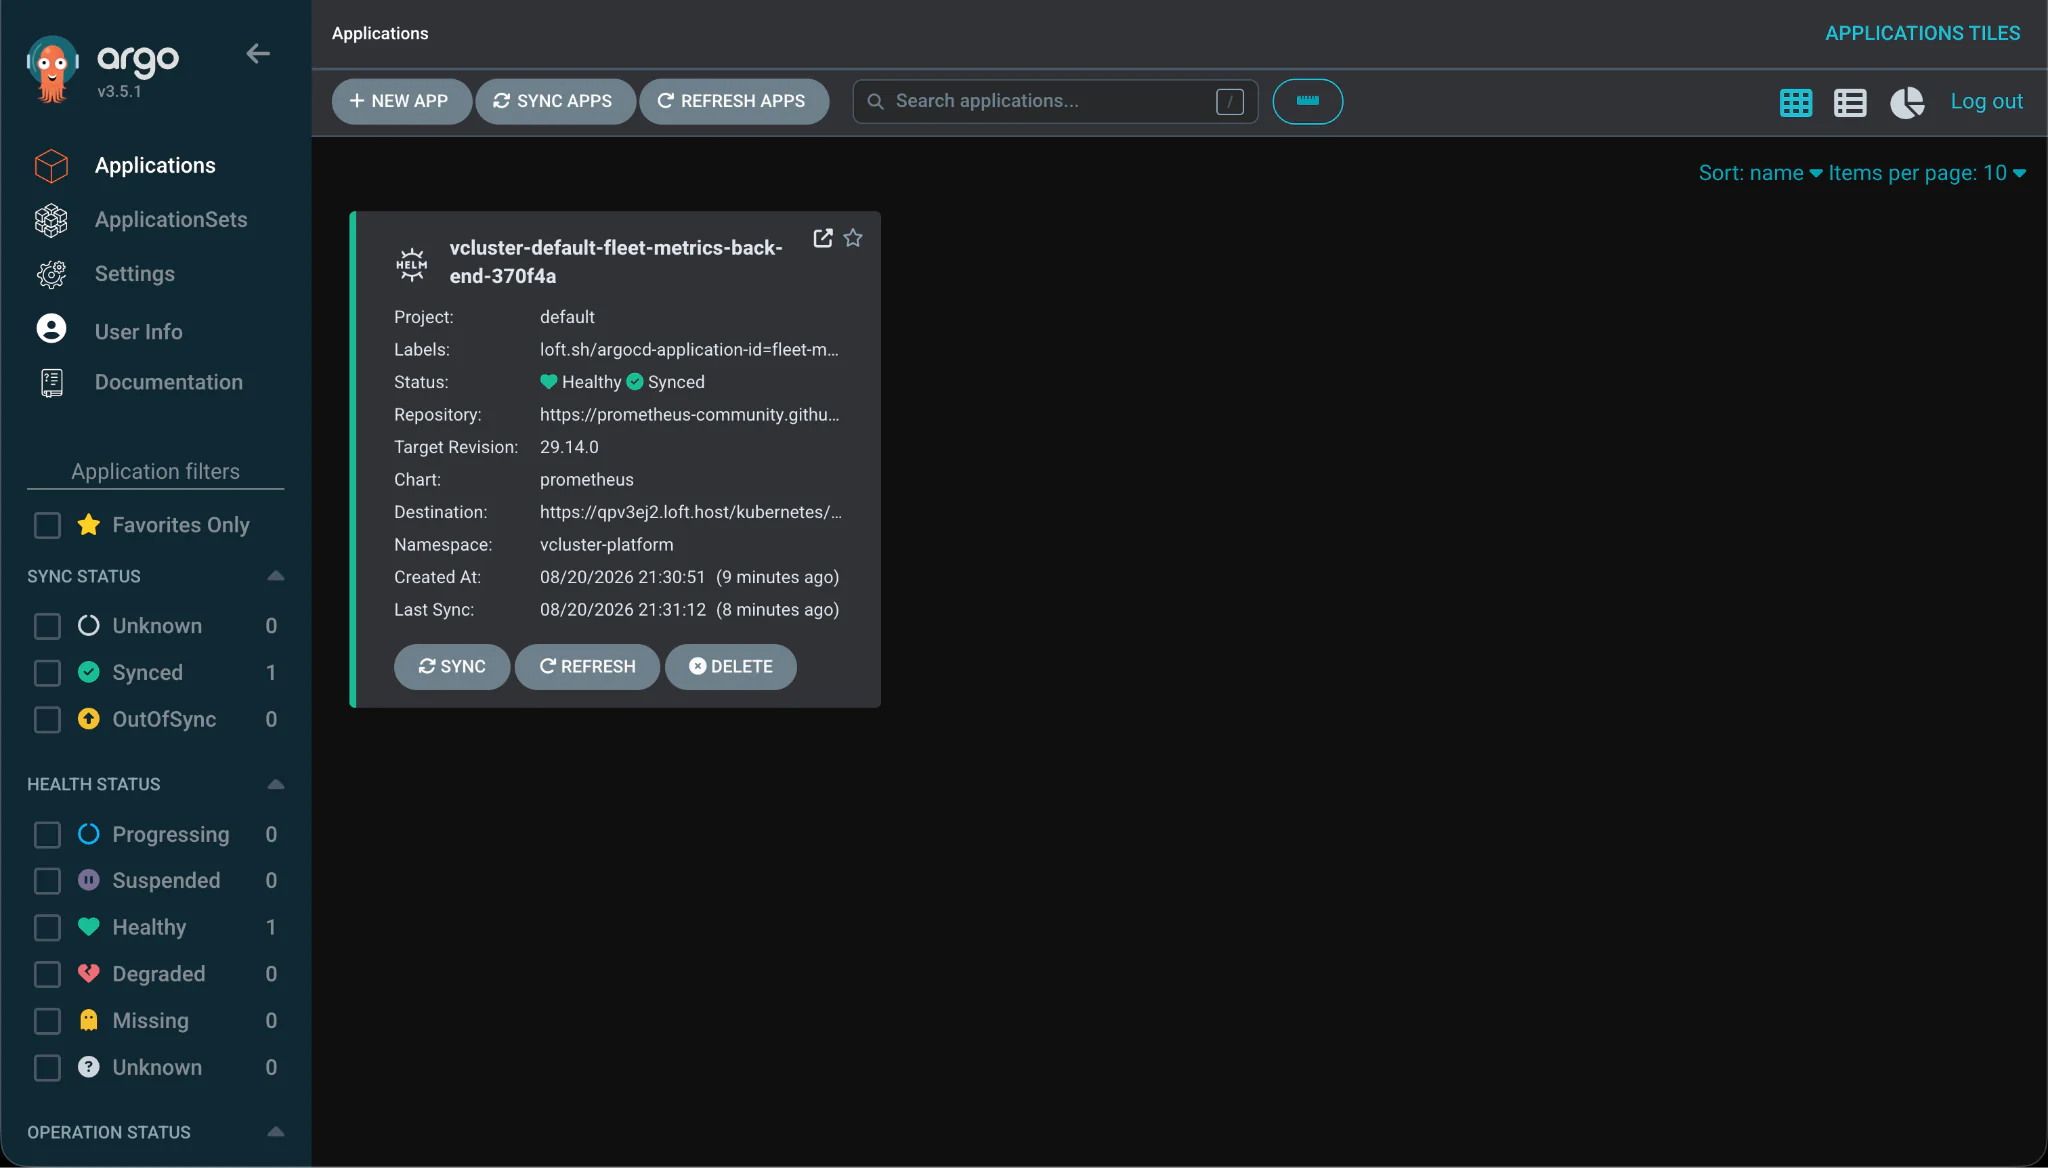
Figure 4: The Fleet Observability metrics backend application synchronized in Argo CD.
The gateway is the authenticated front door for the entire fleet. Tenant collectors write to it over OTLP, Grafana reads from it over PromQL, and on both paths it checks which project and which tenant cluster the caller is entitled to touch before letting anything through.
Like the Argo CD integration, it is configured with a labeled Secret rather than a values file:
apiVersion: v1
kind: Secret
metadata:
  name: fleet-observability
  namespace: vcluster-platform
  labels:
    loft.sh/connector-type: observability
    platform.vcluster.com/fleet-observability-connector: "true"
type: Opaque
stringData:
  metricsBackendOtlpEndpoint: https://prom-prometheus-server.vcluster-platform.svc.cluster.local/api/v1/otlp
  metricsBackendPromQLEndpoint: https://prom-prometheus-server.vcluster-platform.svc.cluster.local
  metricsBackendCertSecretName: metrics-backend-mtls
  grafanaUrl: https://grafana.vcluster-platform.svc.cluster.local
  grafanaCertSecretName: grafana-server-tls
  fleetObservabilityDashboardUid: vcluster-fleet-observability
Applying the Secret is the entire trigger. Platform sees the label and reconciles the gateway Deployment for you:
$ kubectl apply -f fleet-observability-connector.yaml
secret/fleet-observability created
Let's look at the status after deployment:
$ kubectl get pods -n vcluster-platform \
  -l app.kubernetes.io/name=gateway,app.kubernetes.io/instance=fleet-observability

NAME                                           READY   STATUS    RESTARTS   AGE
gateway-fleet-observability-6c4db65645-rr2tp   2/2     Running   0          65s
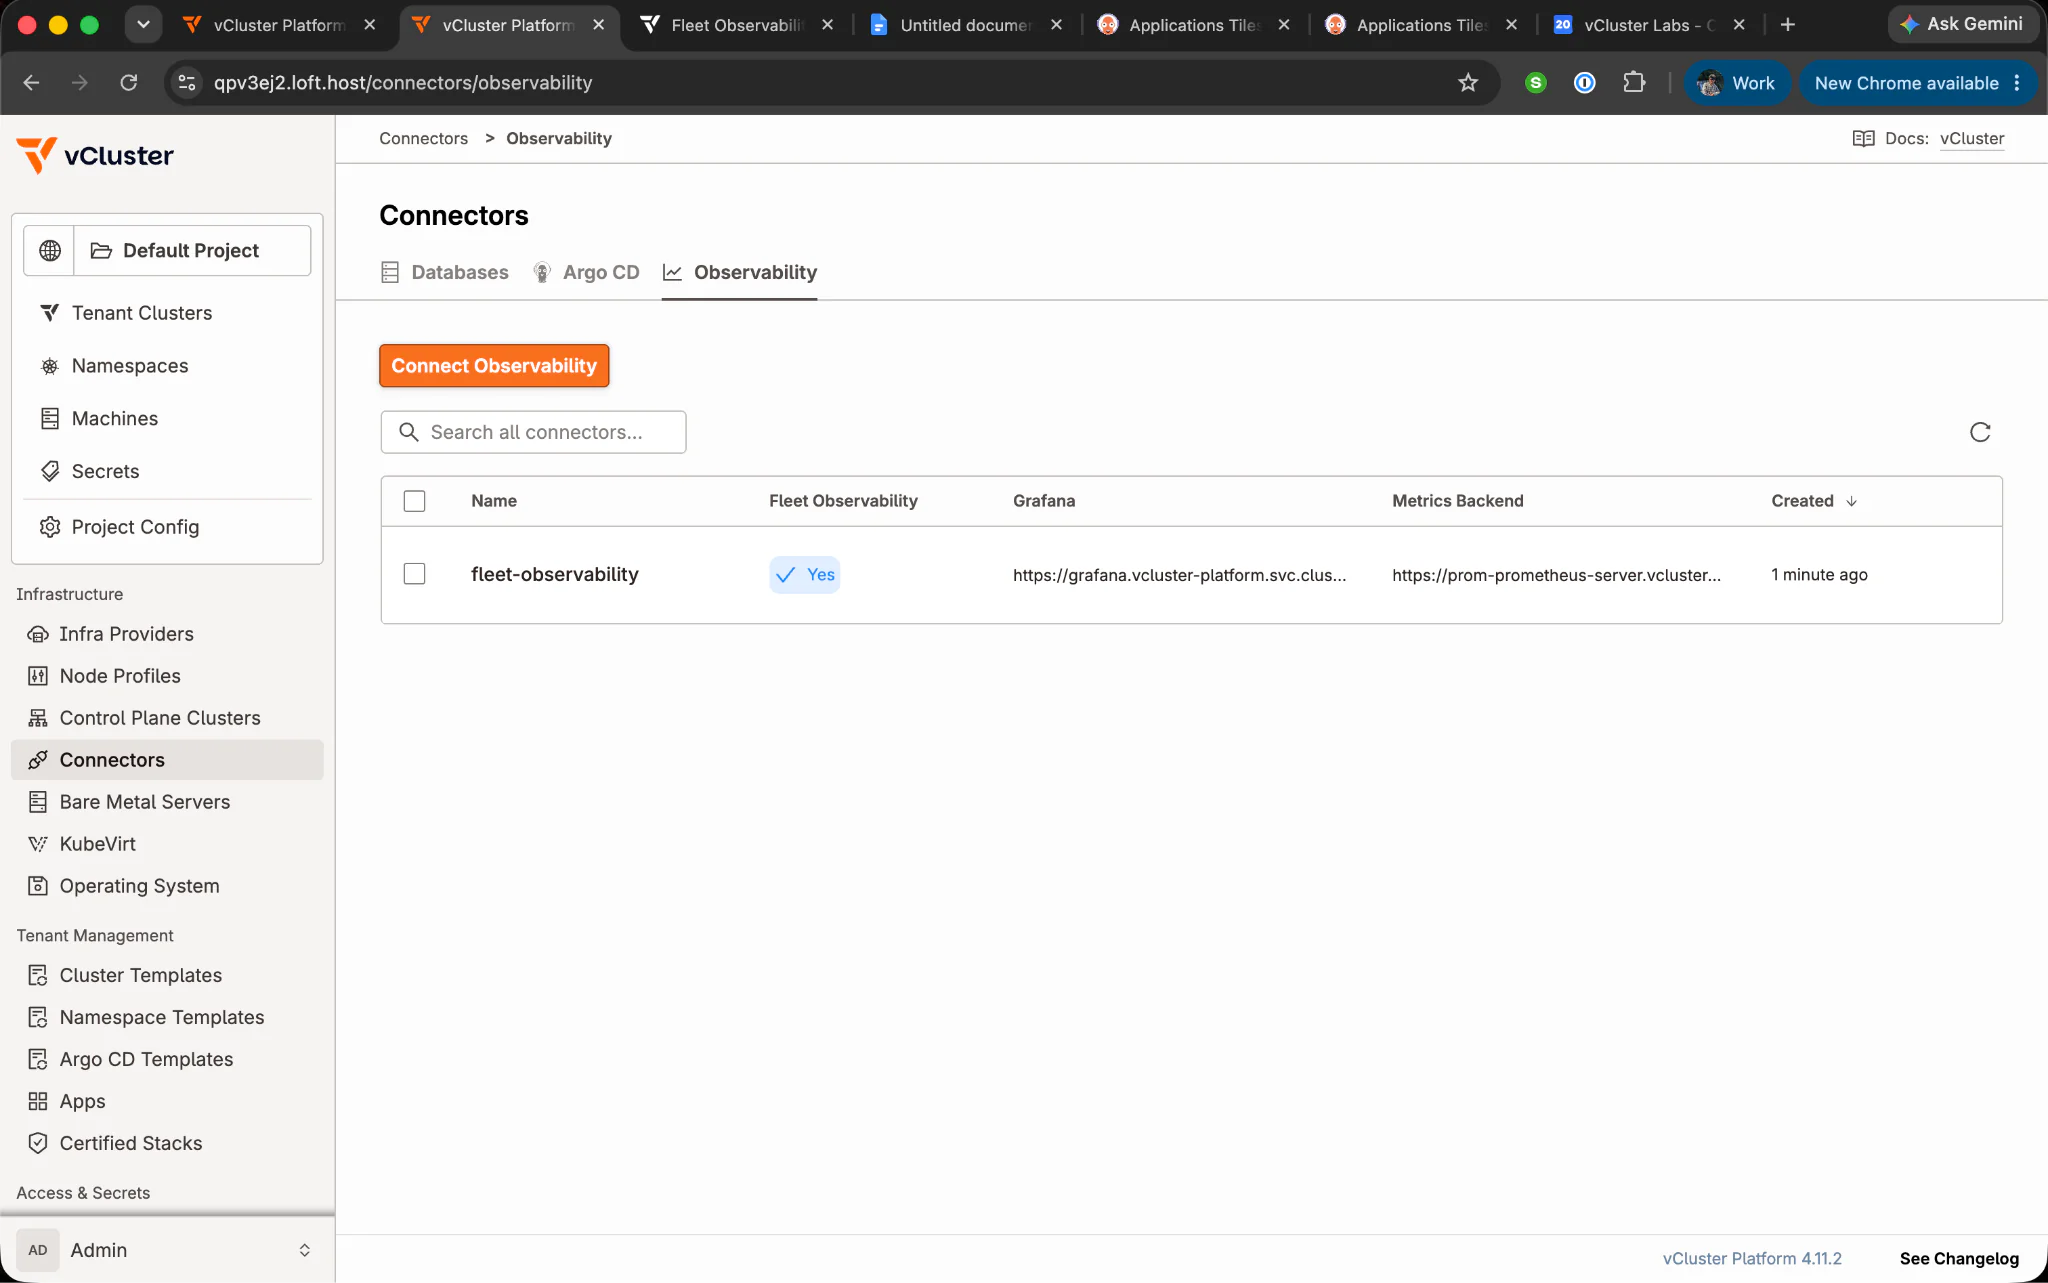
Figure 5: The Fleet Observability connector registered in vCluster Platform.
Note: The second container is the authentication sidecar. A gateway pod at 1/2 indicates that the gateway process is running, but its authentication component is not ready, so incoming writes cannot be authorized. From the collector side, this can resemble a network failure. A 2/2 status confirms that both containers are ready before the collector is configured.
The tenant cluster configuration carries four settings that matter for this pipeline, and each one solves a specific problem:
# vcluster.yaml
controlPlane:
  coredns:
    enabled: true
    embedded: true
networking:
  resolveDNS:
    - service: vcluster-platform/gateway-fleet-observability
      target:
        hostService: vcluster-platform/gateway-fleet-observability
integrations:
  argoCD:
    enabled: true
    connector: argocd-main
sync:
  fromHost:
    nodes:
      enabled: true
      selector:
        all: true
resolveDNS. This is the setting that makes the whole topology work without exposing anything. It maps the gateway's Service name into the tenant cluster's own DNS, so a collector running inside the tenant can resolve gateway-fleet-observability.vcluster-platform.svc.cluster.local and reach the real gateway on the Control Plane Cluster. Without it you are back to ingress, certificates, and a publicly reachable metrics endpoint.
controlPlane.coredns.embedded: true. The resolveDNS rewrite is implemented in the tenant cluster's CoreDNS, so the embedded CoreDNS has to be enabled for the mapping above to take effect.
integrations.argoCD. This is what allows Platform to target this tenant cluster as a deployment destination. The collectors in Step 7 are deployed from the Control Plane Cluster into this tenant cluster, and this line is the permission that makes that possible.
sync.fromHost.nodes. Node objects from the Control Plane Cluster are made visible inside the tenant cluster. The collectors need them in order to attribute pod and container metrics to real hardware; without node visibility the metrics arrive but cannot be grouped by node.
Create it:
vcluster platform create vcluster my-vcluster --project default --values vcluster.yaml
Once created successfully, the output would look like this:
21:37:21 info   Creating virtual cluster my-vcluster in project default...
21:38:02 info   Waiting for virtual cluster to be available...
21:38:25 done   Successfully created the virtual cluster my-vcluster in project default
21:38:28 done   Switched active kube context to vcluster-platform_my-vcluster_default_gke_hrittik-project_us-central1-a_cluster-1
The final line shows that the CLI switches the active kube context to the new tenant cluster after creation. The remaining steps alternate between the tenant cluster and the Control Plane Cluster, so each context switch is shown explicitly before the related commands.
Writes to the gateway are authenticated and scoped, which means the collector needs a credential before it needs anything else. A metrics-writer AccessKey binds a token to one project and one tenant cluster, so the collectors in my-vcluster can only produce metrics that appear under my-vcluster.
AccessKey is a Platform resource, so this runs on the Control Plane Cluster:
kubectx gke_hrittik-project_us-central1-a_cluster-1
Once you are at the Control Plane context, run the following command to add an Access Key:
PROJECT=default
TENANT_CLUSTER=my-vcluster
KEY=$(head -c 20 /dev/urandom | od -An -tx1 | tr -d ' \n')

kubectl apply -f - <<EOF
apiVersion: storage.loft.sh/v1
kind: AccessKey
metadata:
  name: "loft-metrics-writer-p-${PROJECT}-${TENANT_CLUSTER}"
spec:
  type: Other
  key: "${KEY}"
  subject: "loft:metrics-writer:p-${PROJECT}:${TENANT_CLUSTER}"
  groups:
    - loft:system:metrics-writers
  scope:
    roles:
      - role: metrics-writer
    virtualClusters:
      - project: ${PROJECT}
        virtualCluster: "${TENANT_CLUSTER}"
EOF

echo "token: ${KEY}"
A successful creation would look like this:
accesskey.storage.loft.sh/loft-metrics-writer-p-default-my-vcluster created
token: 3181b8c8979723cb71c127f76e88b3549eeb23d8
subject and groups. The subject encodes the role, project, and tenant cluster into an identity string, and the group grants the role. Together they are what the gateway reads to decide whether an incoming write belongs where it claims to belong.
scope.virtualClusters. This is the boundary that matters. Even with a valid token, a write claiming to be from another tenant cluster is rejected, because the scope names exactly one.
The command prints the generated token, which is used in the next step to create a Secret inside the tenant cluster.
Switch to the tenant cluster and give the collectors their credential:
kubectx vcluster-platform_my-vcluster_default_gke_hrittik-project_us-central1-a_cluster-1
kubectl create namespace observability
apiVersion: v1
kind: Secret
metadata:
  name: otel-otlp-auth
  namespace: observability
type: Opaque
stringData:
  authorization: "Bearer REPLACE_WITH_METRICS_WRITER_KEY"
The authorization value must include the Bearer prefix because the collector copies it directly into the Authorization header of every OTLP request. A bare token results in an invalid header and an HTTP 401 response from the gateway. This failure appears in the collector logs and in the gateway's auth_decisions_total{outcome="unauthenticated"} metric, while the application itself can continue to appear healthy.
The collectors run inside the tenant cluster, but the platform team deploys them from the Control Plane Cluster as a Platform-managed Argo CD application. This keeps collector configuration and lifecycle under platform control without requiring tenant users to manage the observability stack themselves.
kubectx gke_hrittik-project_us-central1-a_cluster-1
Once you are in the context, the next step is to deploy the edge collector:
kubectl apply -f - <<EOF
apiVersion: management.loft.sh/v1
kind: ArgoCDApplication
metadata:
  name: fleet-edge-collectors-my-vcluster # include the tenant cluster name for uniqueness
  namespace: p-default # replace with your project namespace
spec:
  displayName: "Fleet edge collectors"
  destination:
    virtualCluster:
      name: my-vcluster # replace with your tenant cluster name
    target: vCluster # deploy into the tenant cluster
  templateRef:
    name: cluster-collector
  parameters:
    destinationNamespace: observability
    otlpEndpoint: https://gateway-fleet-observability.vcluster-platform.svc.cluster.local:4318
    otlpInsecureSkipVerify: "true"
    project: default
EOF
A successful deployment produces the output shown below. Since this is an Argo CD application, you can also monitor its deployment and synchronization status in the Argo CD dashboard:
argocdapplication.management.loft.sh/fleet-edge-collectors-my-vcluster created
One useful property comes for free: because the application targets the tenant cluster, deleting the tenant cluster removes the collectors along with it. There is no orphaned DaemonSet to clean up and no stale application left pointing at something that no longer exists.
Before building a dashboard, validate the scoped query path. Mint a metrics-reader key alongside the writer, port-forward to the gateway, and run a PromQL query with the headers the gateway uses to identify the caller:
PROJECT=default
TENANT_CLUSTER=my-vcluster
METRICS_READER_TOKEN=$(head -c 20 /dev/urandom | od -An -tx1 | tr -d ' \n')

kubectl apply -f - <<EOF
apiVersion: storage.loft.sh/v1
kind: AccessKey
metadata:
  name: "loft-metrics-reader-p-${PROJECT}-${TENANT_CLUSTER}"
spec:
  type: Other
  key: "${METRICS_READER_TOKEN}"
  subject: "loft:metrics-reader:p-${PROJECT}:${TENANT_CLUSTER}"
  groups:
    - loft:system:metrics-readers
  scope:
    roles:
      - role: metrics-reader
    virtualClusters:
      - project: ${PROJECT}
        virtualCluster: "${TENANT_CLUSTER}"
EOF
Now to test it out:
GATEWAY_POD=$(kubectl get pod -n vcluster-platform \
  -l app.kubernetes.io/name=gateway,app.kubernetes.io/instance=fleet-observability \
  -o jsonpath='{.items[0].metadata.name}')

kubectl port-forward -n vcluster-platform pod/$GATEWAY_POD 8081:8081 &
PF_PID=$!

curl -k -G --retry 5 --retry-connrefused --retry-delay 1 \
  -H "Authorization: Bearer $METRICS_READER_TOKEN" \
  -H "X-Vcluster-Platform-Project: $PROJECT" \
  -H "X-Vcluster-Platform-Instance: $TENANT_CLUSTER" \
  --data-urlencode 'query=up' \
  https://127.0.0.1:8081/api/v1/query

kill $PF_PID
A response with "status": "success" confirms that the gateway accepted the request and forwarded a valid PromQL query:
{
  "status": "success",
  "data": {
    "resultType": "vector",
    "result": []
  }
}
However, an empty result array confirms only that the query path responded; it does not confirm that collector writes reached the backend. After at least one scrape interval, rerun the query. A non-empty result confirms the complete write and query path.
Grafana comes from a template as well, and it needs your Platform host so that sign-on and the links back into Platform resolve correctly:
kubectl apply -f - <<EOF
apiVersion: management.loft.sh/v1
kind: ArgoCDApplication
metadata:
  name: fleet-grafana
  namespace: p-default # replace with your project namespace
spec:
  displayName: "Fleet Grafana"
  destination:
    cluster:
      name: loft-cluster # reserved name for Platform's local cluster, do not change
  templateRef:
    name: fleet-observability-grafana
  parameters:
    destinationNamespace: vcluster-platform
    platformHost: qpv3ej2.loft.host
    project: default
EOF
When Grafana is opened for the first time, Platform requests authorization before completing the SSO flow.
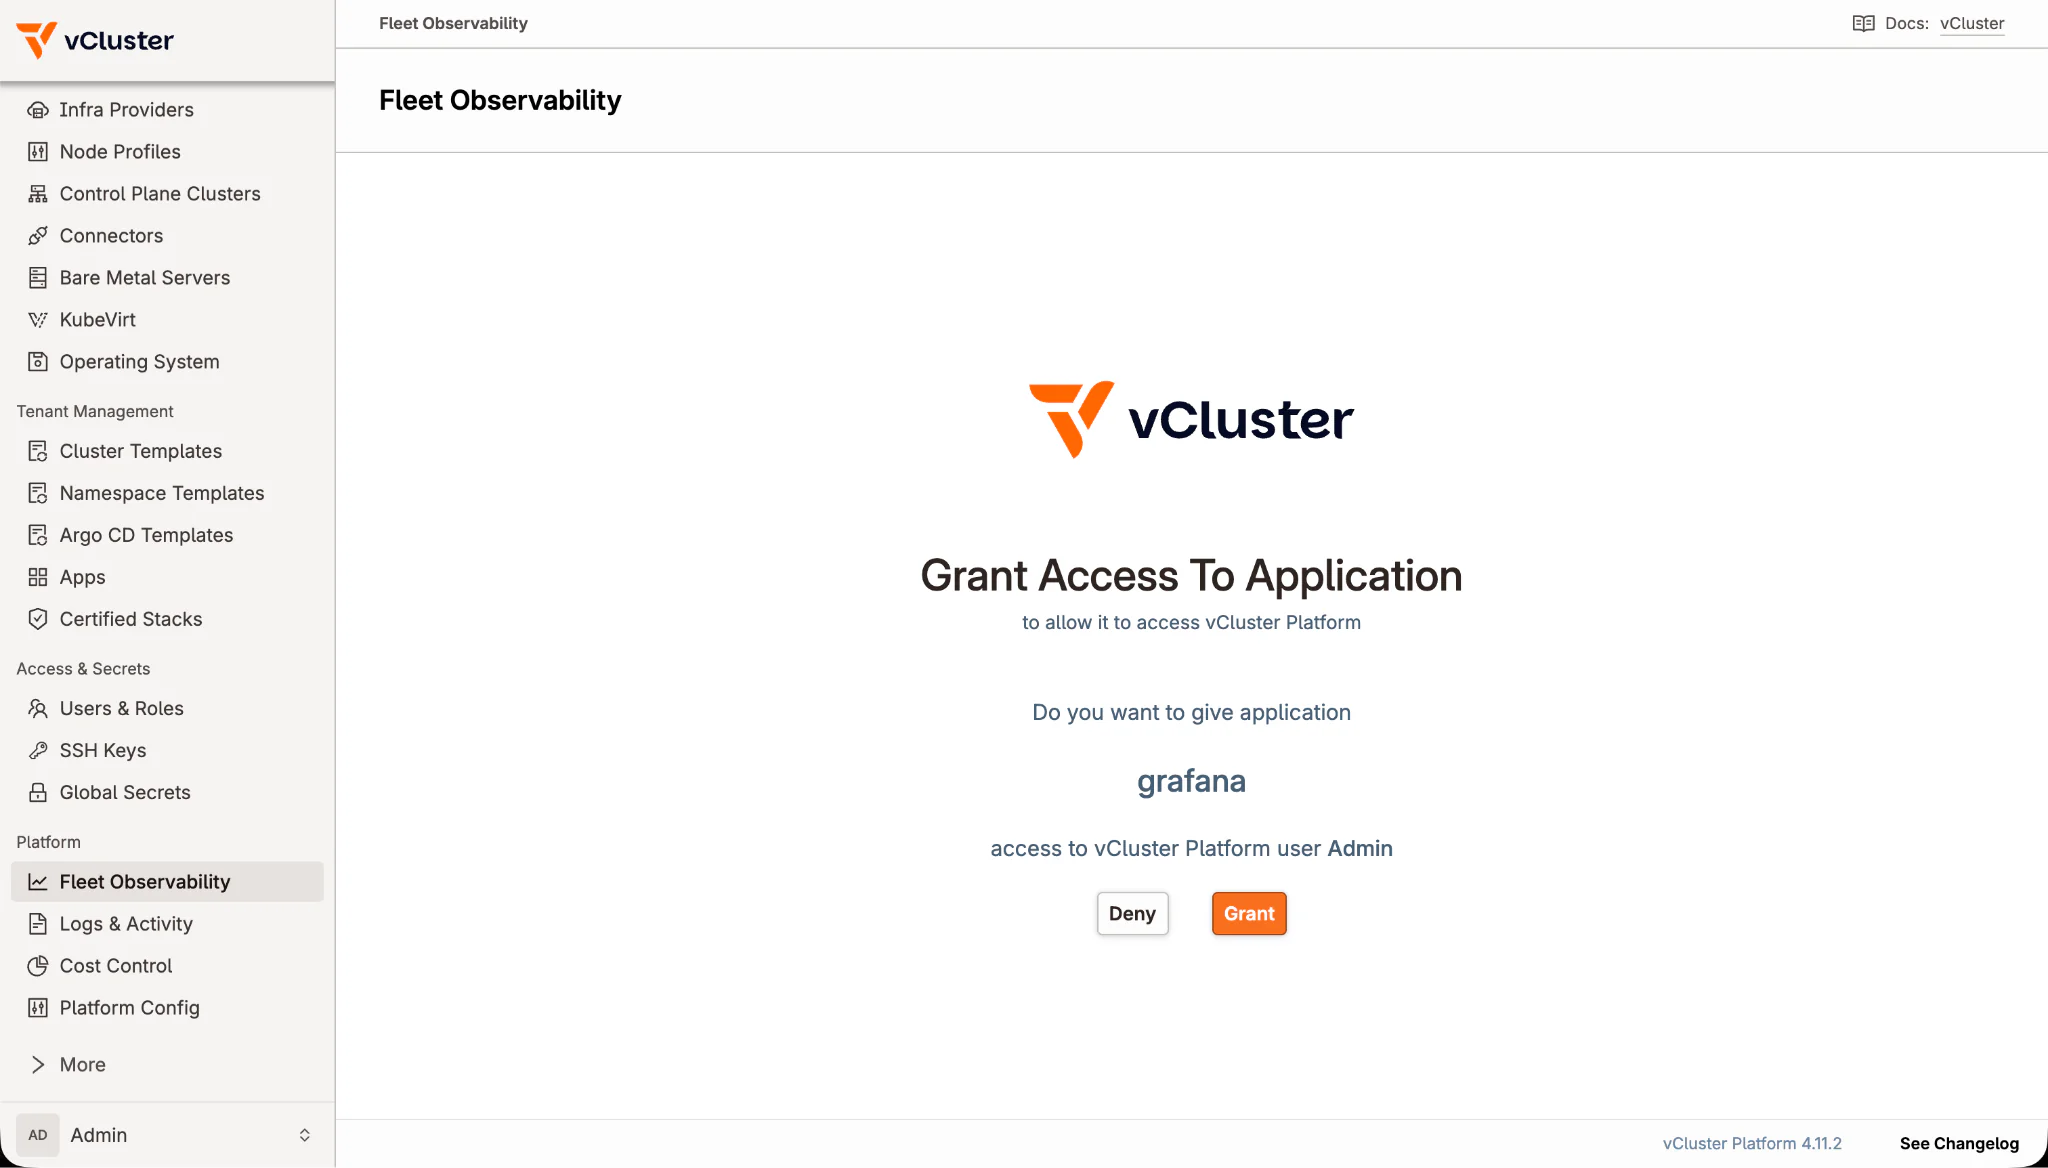
Figure 6: The vCluster Platform authorization prompt used to grant Grafana access.
platformHost: This value is the host printed by vcluster platform start in Step 1. Grafana uses it to build links back to Platform and complete the single sign-on flow. An incorrect value can allow Grafana to render while preventing the Platform integration from completing.
The next step generates visible workload metrics for the dashboard. In the tenant cluster, create a sample deployment with enough replicas to change the pod, CPU, and memory graphs:
$ kubectl create deployment nginx --image=nginx --replicas=30
deployment.apps/nginx created
The sample uses 30 replicas to produce visible changes in pod counts, CPU, and memory within a scrape interval or two.
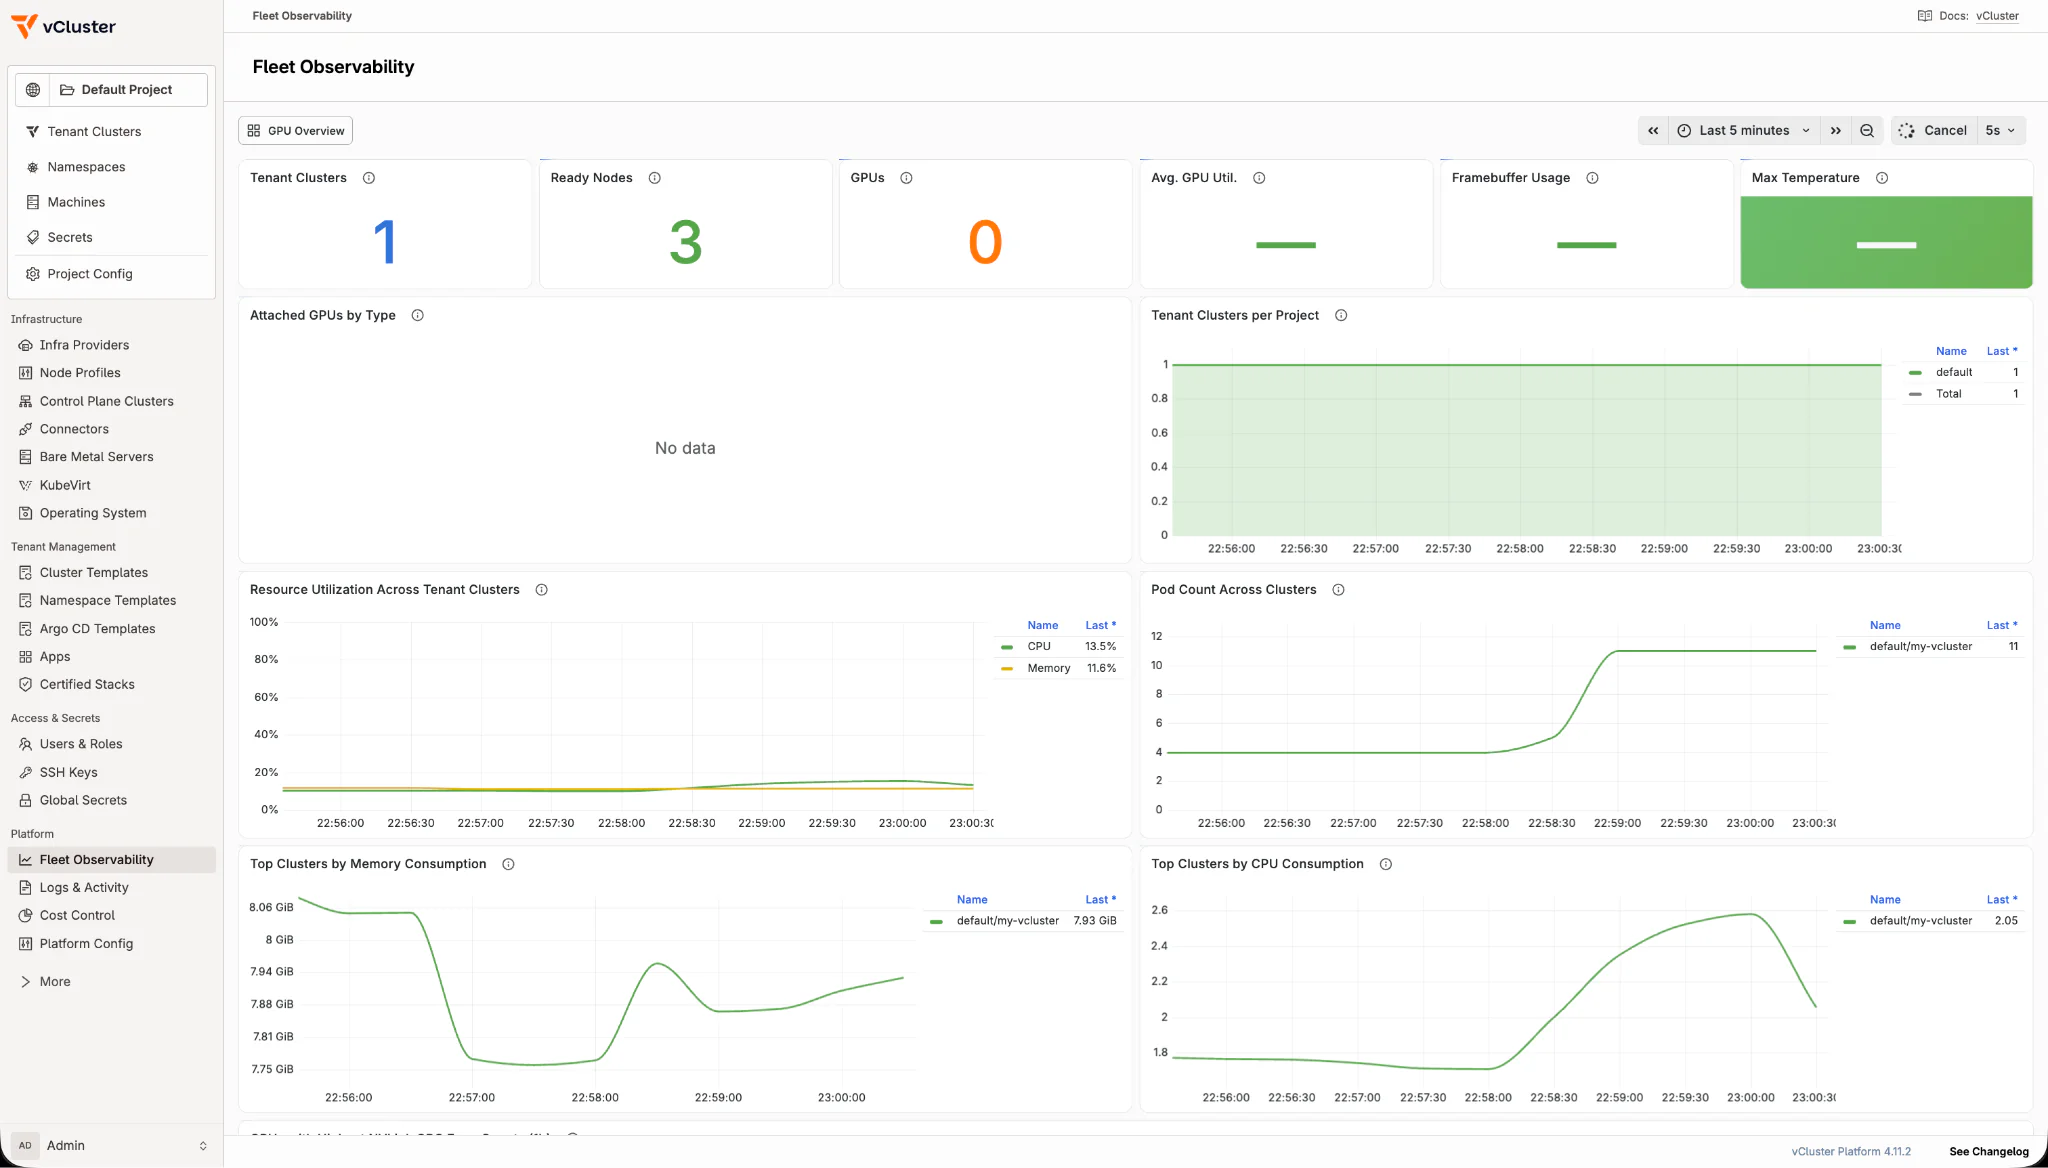
Figure 7: Fleet metrics after deploying the sample NGINX workload.
The populated dashboard attributes the metrics to default/my-vcluster, which matches the project and tenant-cluster scope carried by the writer key.
A second tenant cluster running GPU workloads can use its own scoped writer key. Its metrics appear in the same fleet view while remaining attributed to that tenant-cluster boundary, including GPU-specific health and utilization signals:
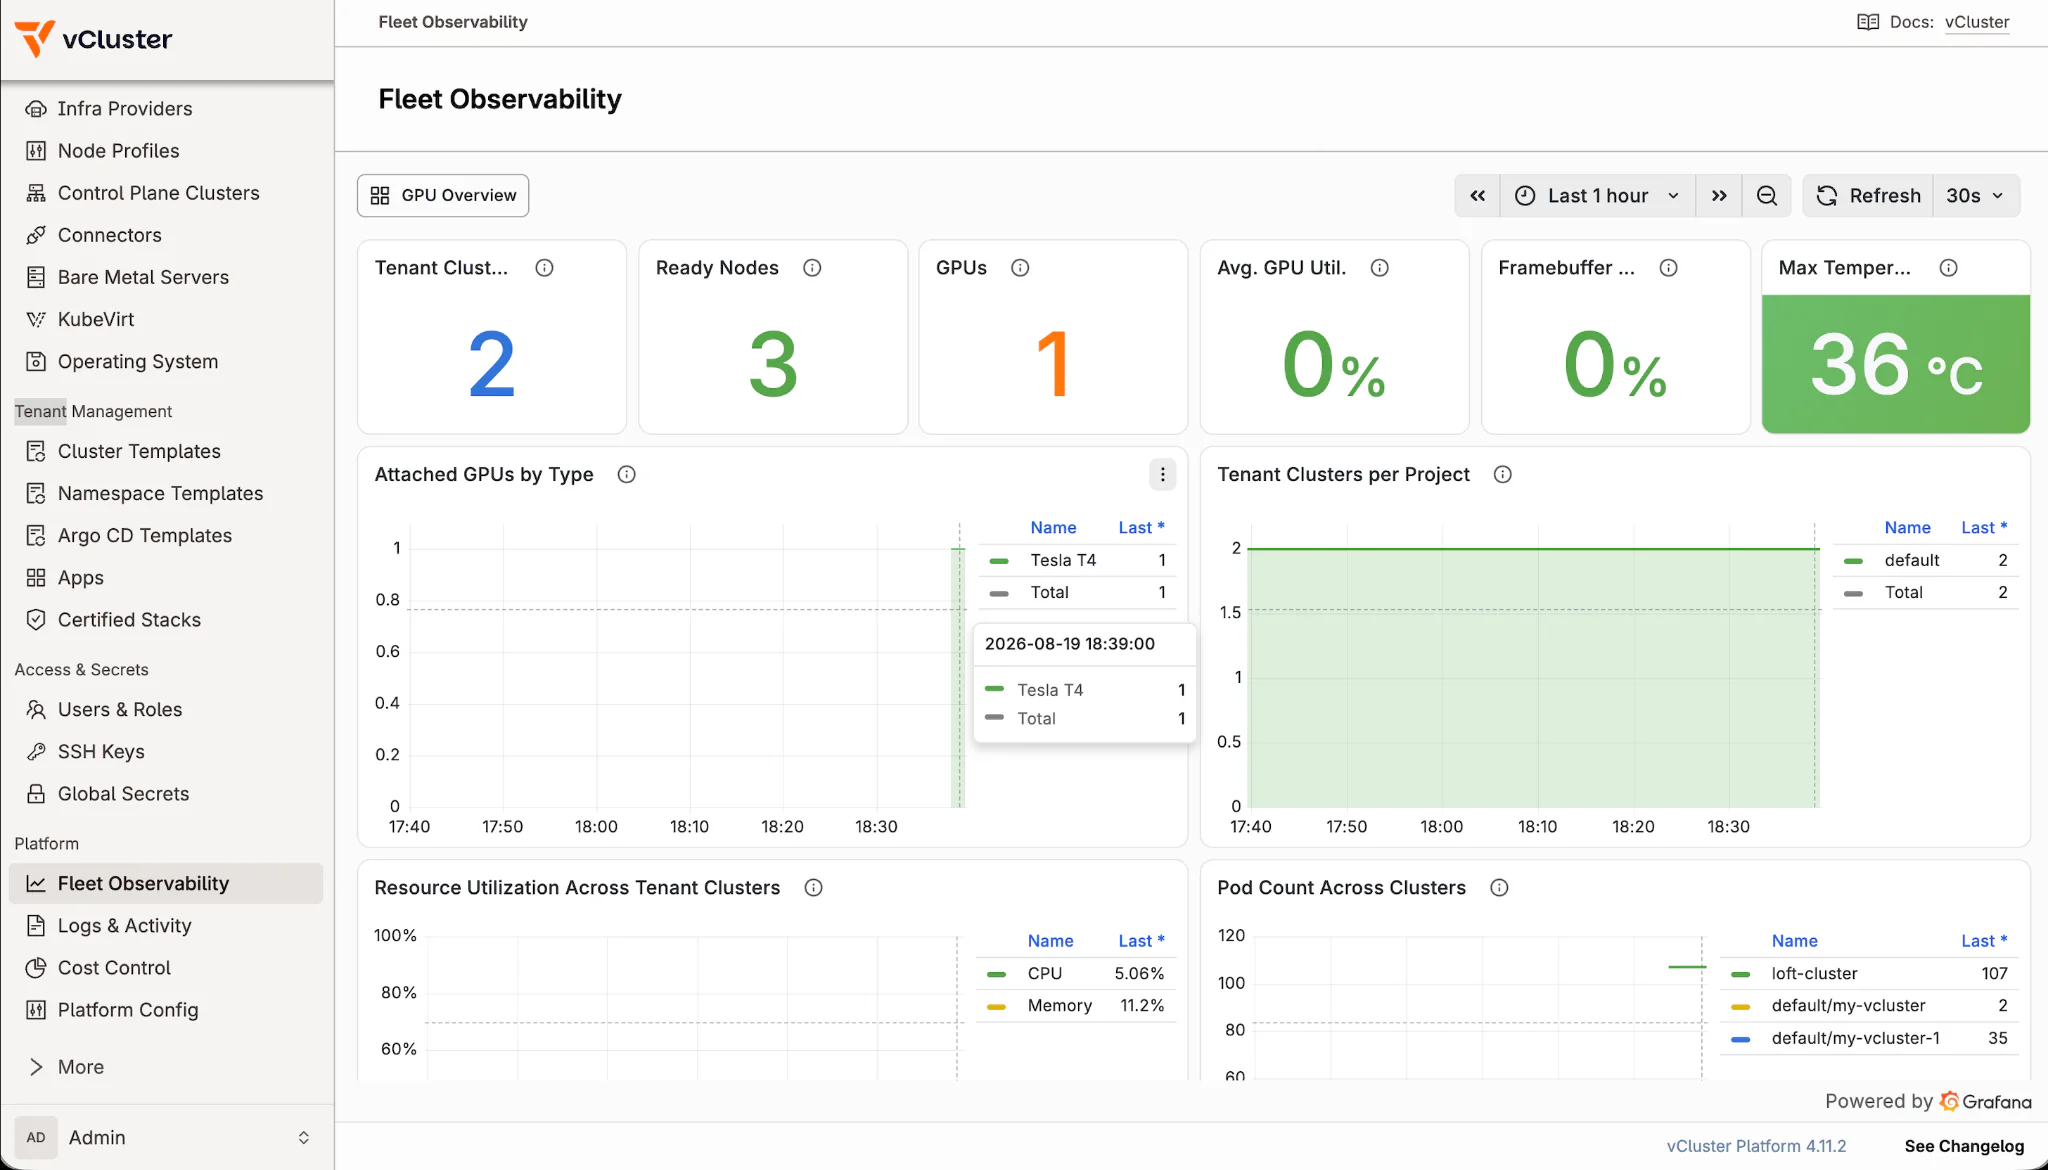
Figure 8: GPU health and utilization summary across two observed tenant clusters.
A detailed GPU view shows how temperature, power, utilization, and framebuffer usage change after running a compute-intensive CUDA workload:
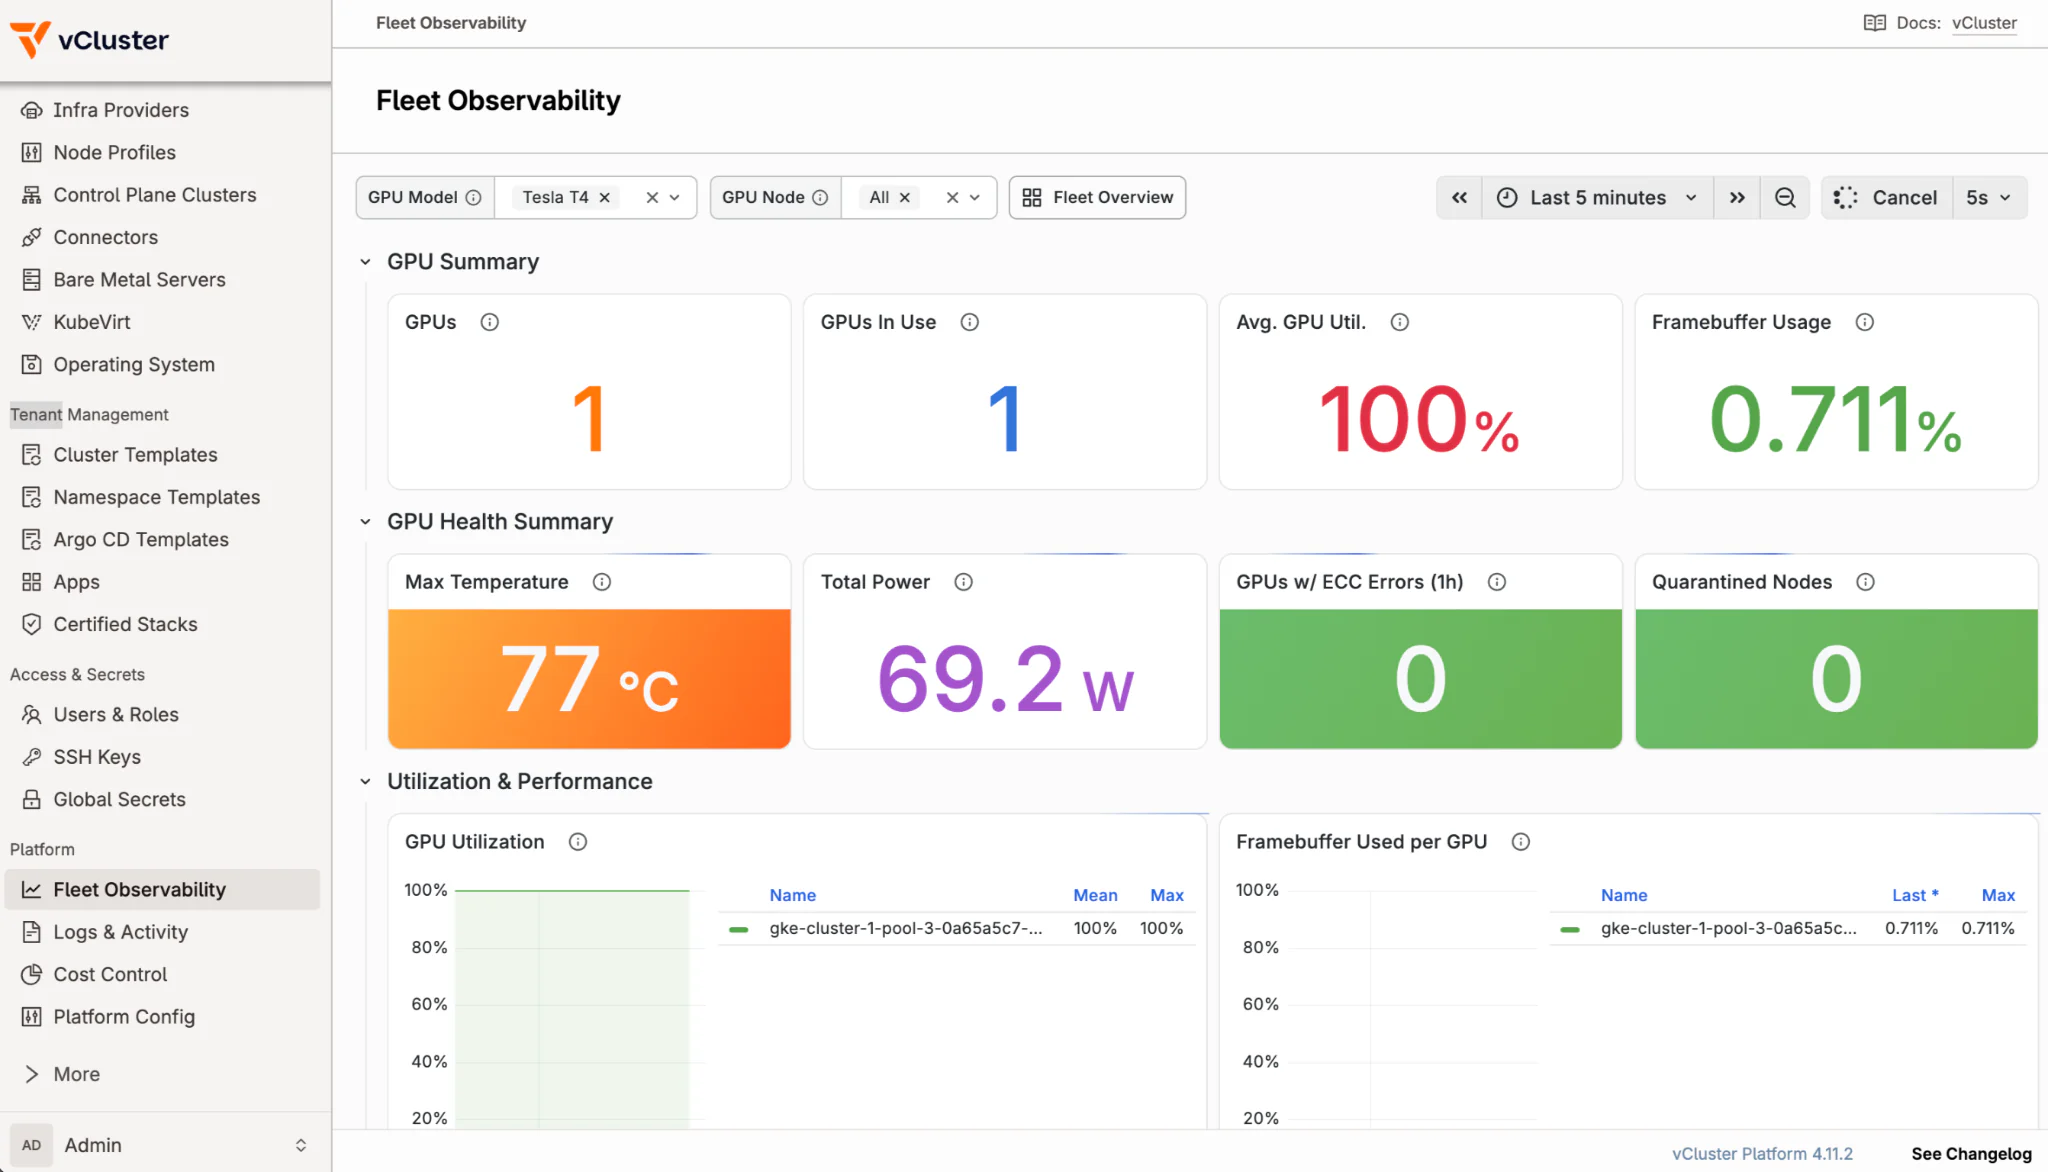
Figure 9: Detailed GPU metrics after running a compute-intensive CUDA workload.
Fleet Observability matters because operating tenant clusters at scale requires more than collecting metrics. Platform teams need a trusted way to understand fleet health, isolate each tenant's view, and move from a fleet-wide signal to the cluster that needs attention without deploying and maintaining a separate observability stack for every tenant.
As you have seen, vCluster Platform v4.11 establishes this operating model through authenticated metrics ingestion, platform-owned labels, scoped queries, and shared dashboards. Together with Node Profiles for consistent private-node configuration and clearer recovery guidance for backing-store incidents, this release makes day-2 operations across growing tenant fleets more predictable and easier to manage.
While the current release focuses on metrics, it provides an important foundation for operating increasingly large and diverse vCluster fleets, including GPU-backed environments. To learn more, explore the vCluster Platform v4.11 release, try Fleet Observability in your own environment, and join the vCluster community to share feedback and learn how other platform teams manage tenant clusters at scale.
Deploy your first virtual cluster today.
