Kubernetes Monitoring: Strategy, Best Practices, and Tools to Use

Aug 16, 2022
|
min Read

Kubernetes offers a seamless, distributed solution for managing application workloads hosted across cluster nodes. According to the Cloud Native Computing Foundation’s most recent data, Kubernetes is the leading container orchestration system, with 69% of respondents using Kubernetes in production.
Kubernetes offers many benefits, including improved productivity for engineering teams, efficient autoscaling, and cost savings.
And because a Kubernetes ecosystem comprises multiple machines (nodes) working together within the same subsystem (cluster), making all of these elements observable is a key aspect of maintaining operational efficiency.
In this post, we’ll explore the topic of Kubernetes monitoring, including a brief analysis of some challenges, an overview of the most important metrics to monitor, and some best practices implemented by leading engineering organizations. In addition, we highlight several open-source and commercial tools that allow administrators to monitor component health within a cluster, as well as application performance for the end user.
Kubernetes is incredibly useful in that it abstracts away a lot of complexity in order to speed up deployment. But because of this, engineers are often left in the dark about how resources are being used — it’s hard to tell what is actually happening.
Containers help package responsive, highly available applications as executable units that allow OS-level abstraction. By design, this enables a distributed framework of containerized applications and services that makes monitoring more intricate. Microservices architectures and stateless application design have many benefits; however, these modern software practices tend to lead to dynamic application architectures, which hinder observability. This limited observability makes troubleshooting issues with Kubernetes more complicated.
Kubernetes clusters make use of a number of components and processes that further complicate things: traditional machine monitoring mechanisms are ineffective for checking performance parameters of a dynamically transient services-oriented architecture.
And while the Kubernetes Dashboard allows users to access information on resource utilization, it does not include some of the refined mechanisms needed for monitoring ephemeral application workloads. This is why various mechanisms have been developed to improve monitoring and event logging in Kubernetes clusters.
The best monitoring strategies closely track several metric types, depending on the components being observed. These are:
To make the most of a Kubernetes monitoring solution, it’s important to follow practices that provide valuable insights. Some of these include:
Kubernetes offers two main approaches for collecting data on running clusters: DaemonSets and the Metrics Server.
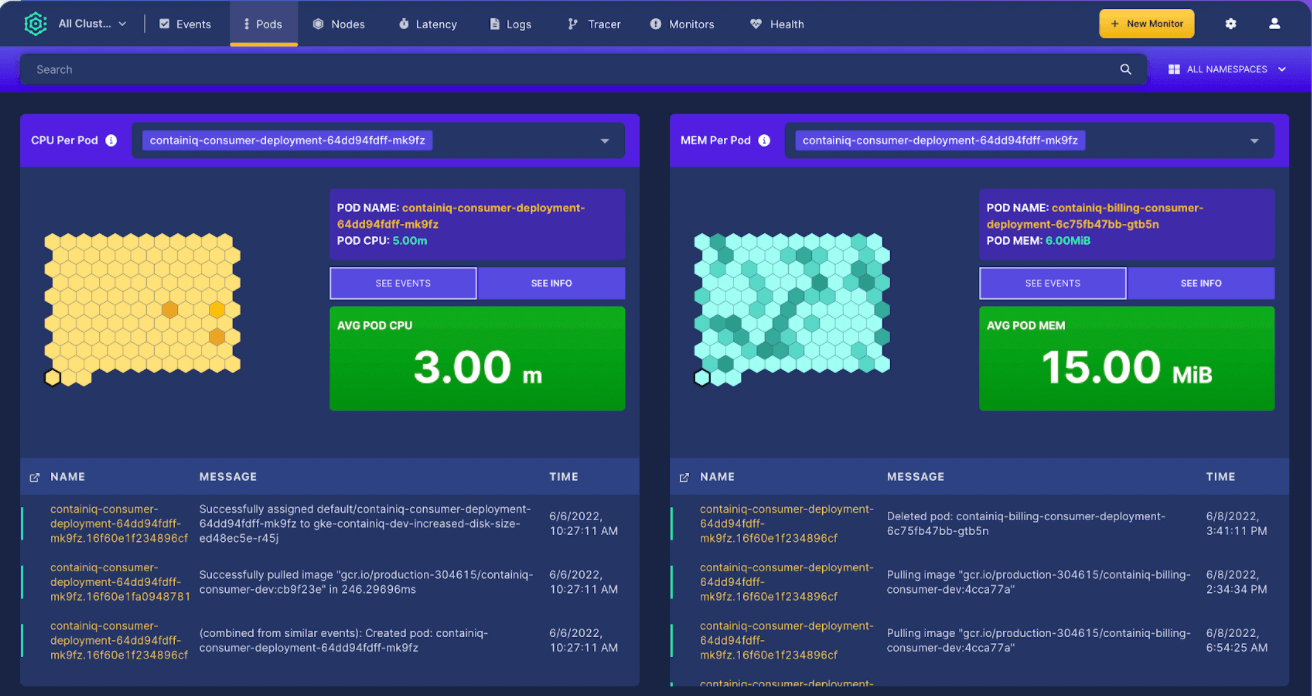
Developed and launched publicly in 2021, ContainIQ is a commercial tool for Kubernetes monitoring, logging, and tracing. ContainIQ is offered both as SaaS and as an on-prem or in-cloud offering. ContainIQ collects core metrics, events, logs, and traces all with a simple out-of-the-box approach. Users are able to search and filter views based on the cluster, namespace, and date range, and use a number of additional filters specific to each dashboard, like protocol and message.
ContainIQ is helpful for debugging issues that happen, maintaining cluster health, and alerting about issues that might cause performance degradation for end users. ContainIQ offers a number of pre-built dashboards that do not require additional configuration. Setting alerts is relatively straightforward and can be done on metrics, events, log messages, latency, and individual requests. Alerts can be sent using a simple Slack channel integration or to a large number of destinations using a webhook. ContainIQ’s SaaS offering is available via a self-service sign-up, and pricing is based on usage.
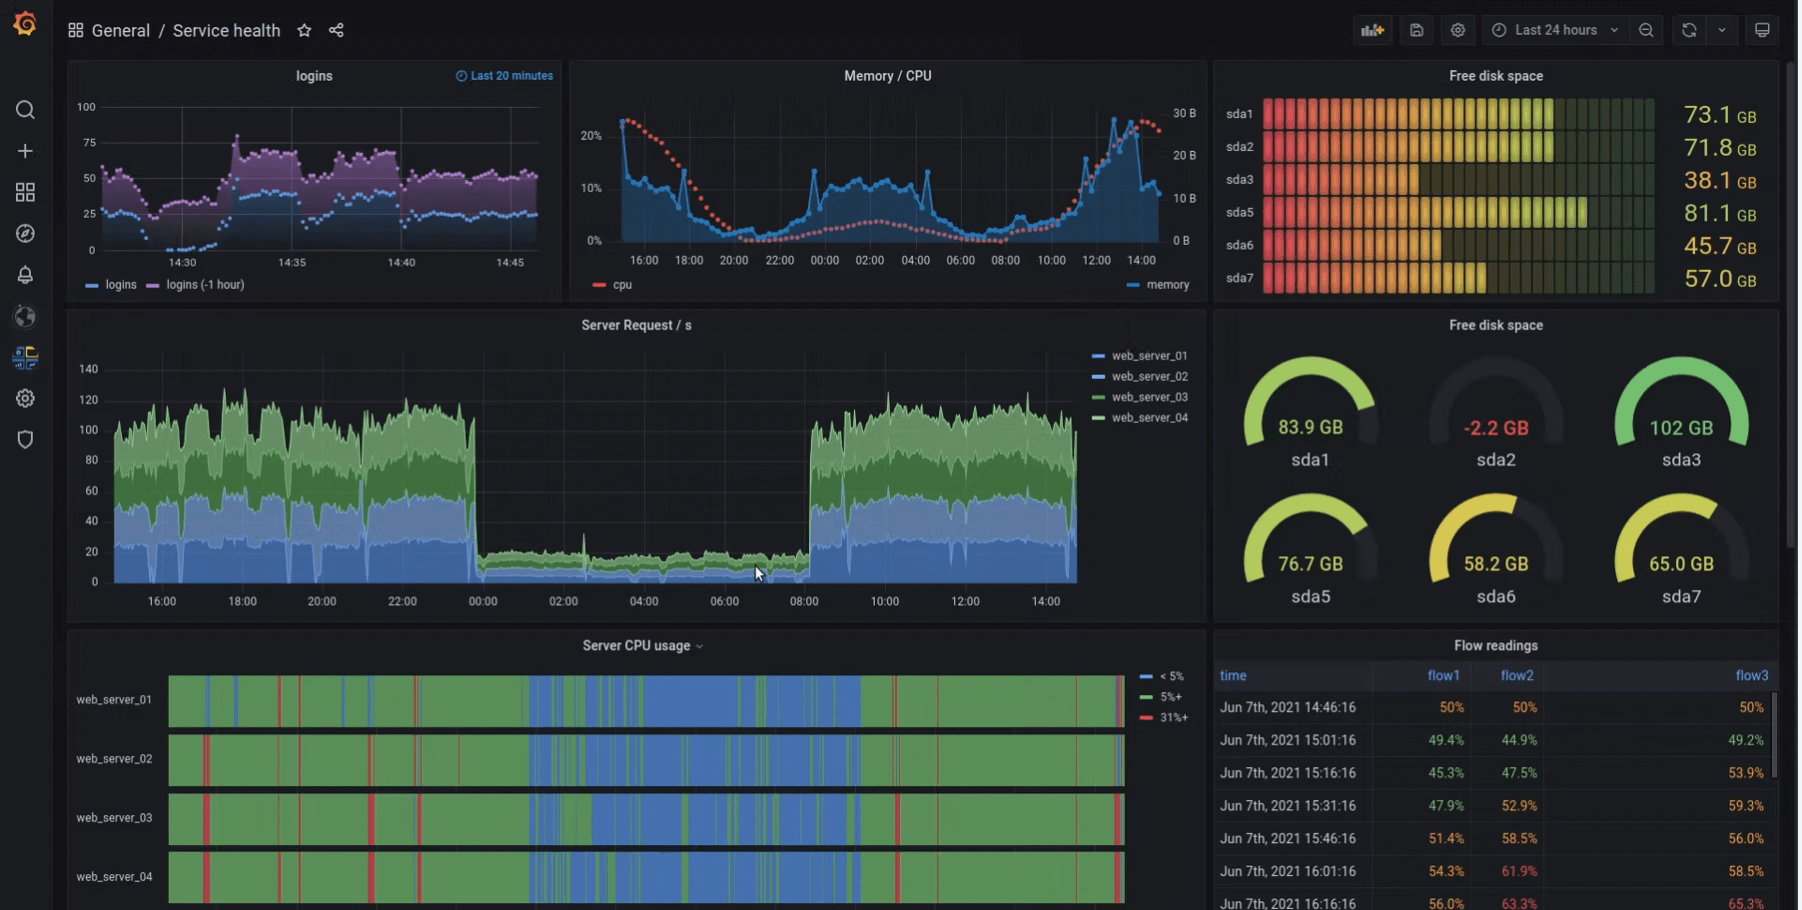
Developed by SoundCloud, Prometheus is an open-source toolkit that supports the instrumentation, collection, and storage of Kubernetes metrics. Prometheus collects and stores cluster performance data, and then it exposes this data through a Prometheus web user interface that lets administrators access, present and chart the collected information. As an extended monitoring layer, Grafana offers a visualization tool that accesses the Prometheus server using Prometheus Query Language (PromQL) for a more comprehensive analysis of performance data. Alertmanager is the popular alerting feature set available in Prometheus.
Prometheus has a large and growing open-source community and offers a large number of integrations with other tools. Prometheus can be self-hosted or can be run as a managed solution by the cloud providers, such as AWS and GCP, and by a number of third-party providers.
As mentioned earlier, Prometheus is often used with Grafana as a visualization tool. Grafana, another open-source project, can be self-hosted or can be used as a SaaS offering with Grafana Cloud.
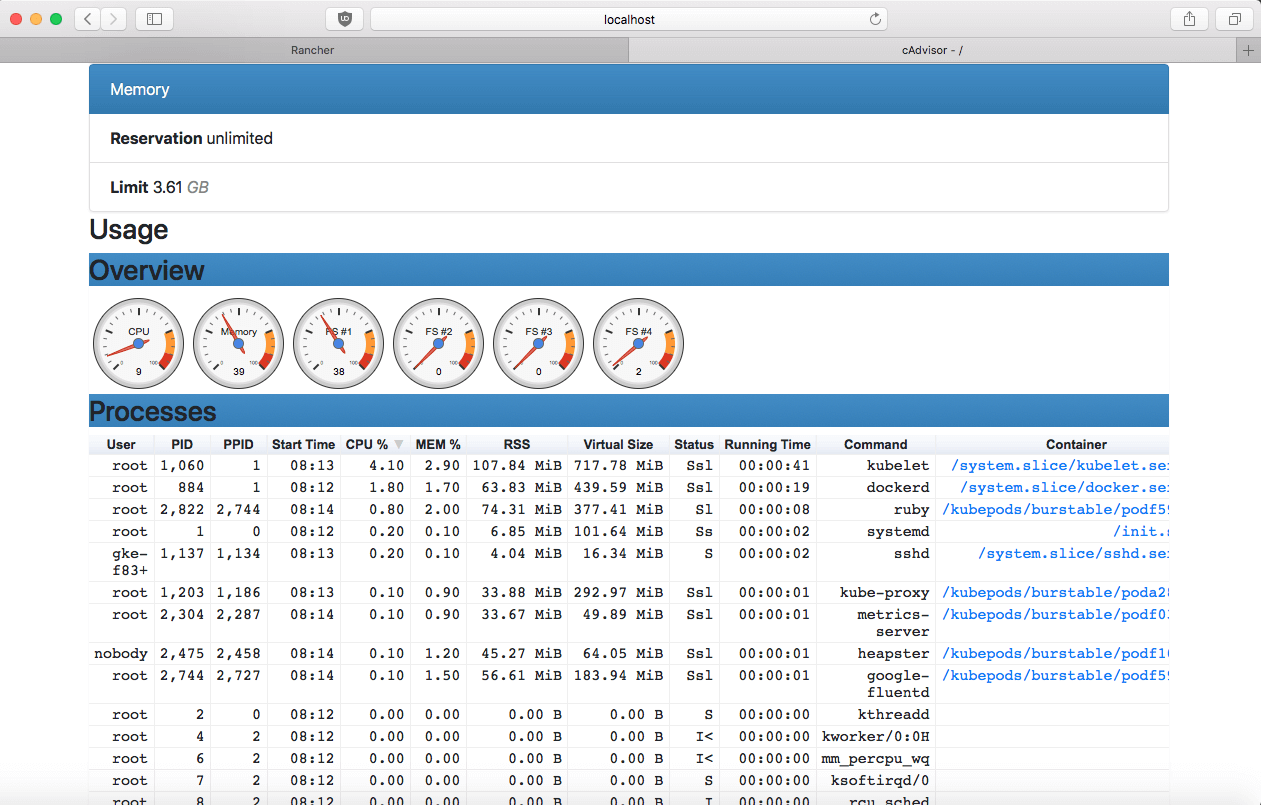
Container Advisor (cAdvisor) is an open-source metrics collection agent specifically built for containers. This solution runs at a node level, since it comes integrated with the kubelet service as one of the binaries. cAdvisor gathers data on CPU usage, memory usage, network status, and storage for every live container, helping administrators gain insight into machine-level performance metrics.
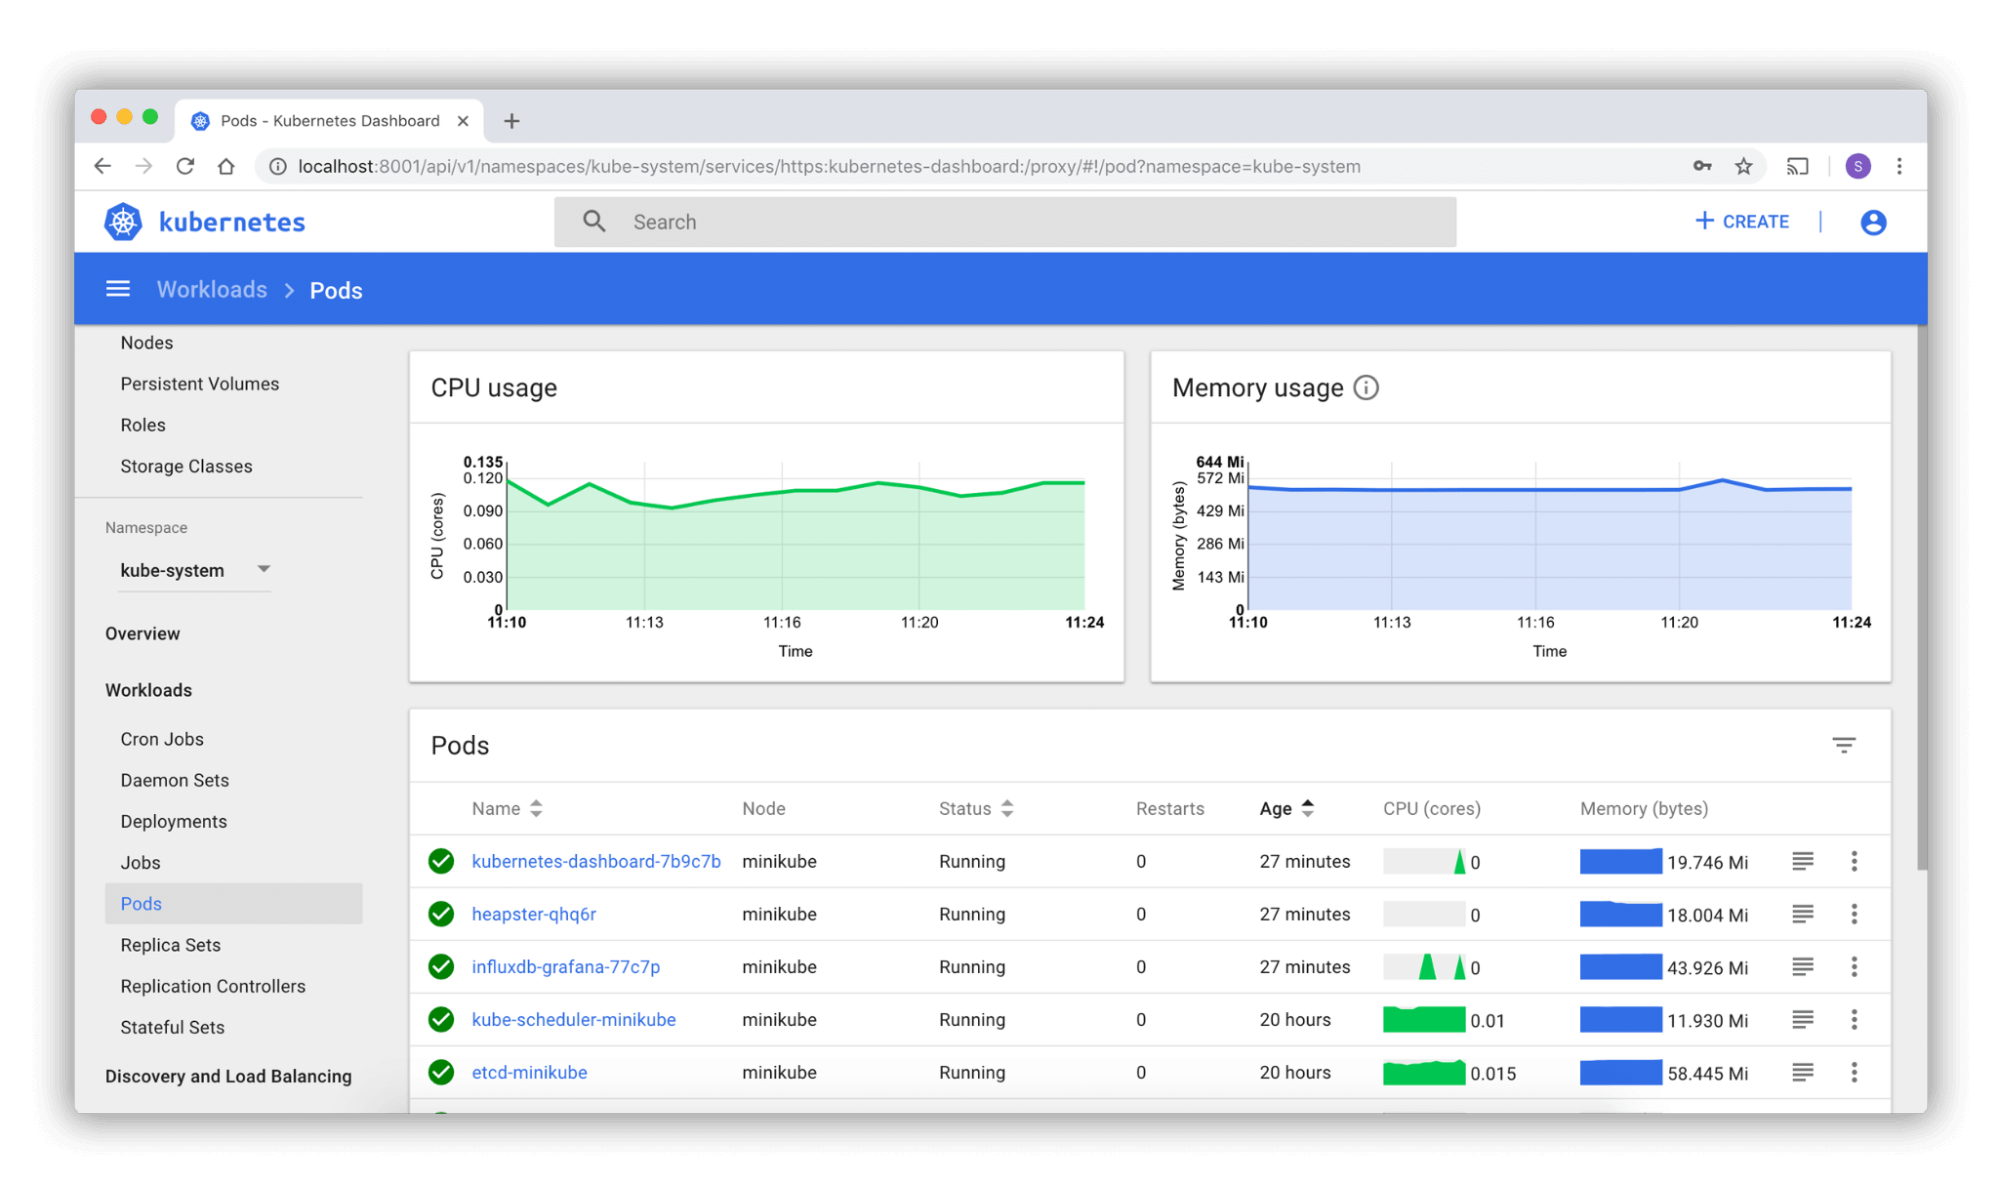
Through a web-based user interface, Kubernetes helps administrators manage cluster resources and troubleshoot containerized applications. The dashboard displays an overview of running applications within the cluster. Administrators can also access information on the state of cluster resources, including errors and other events that may affect application performance.
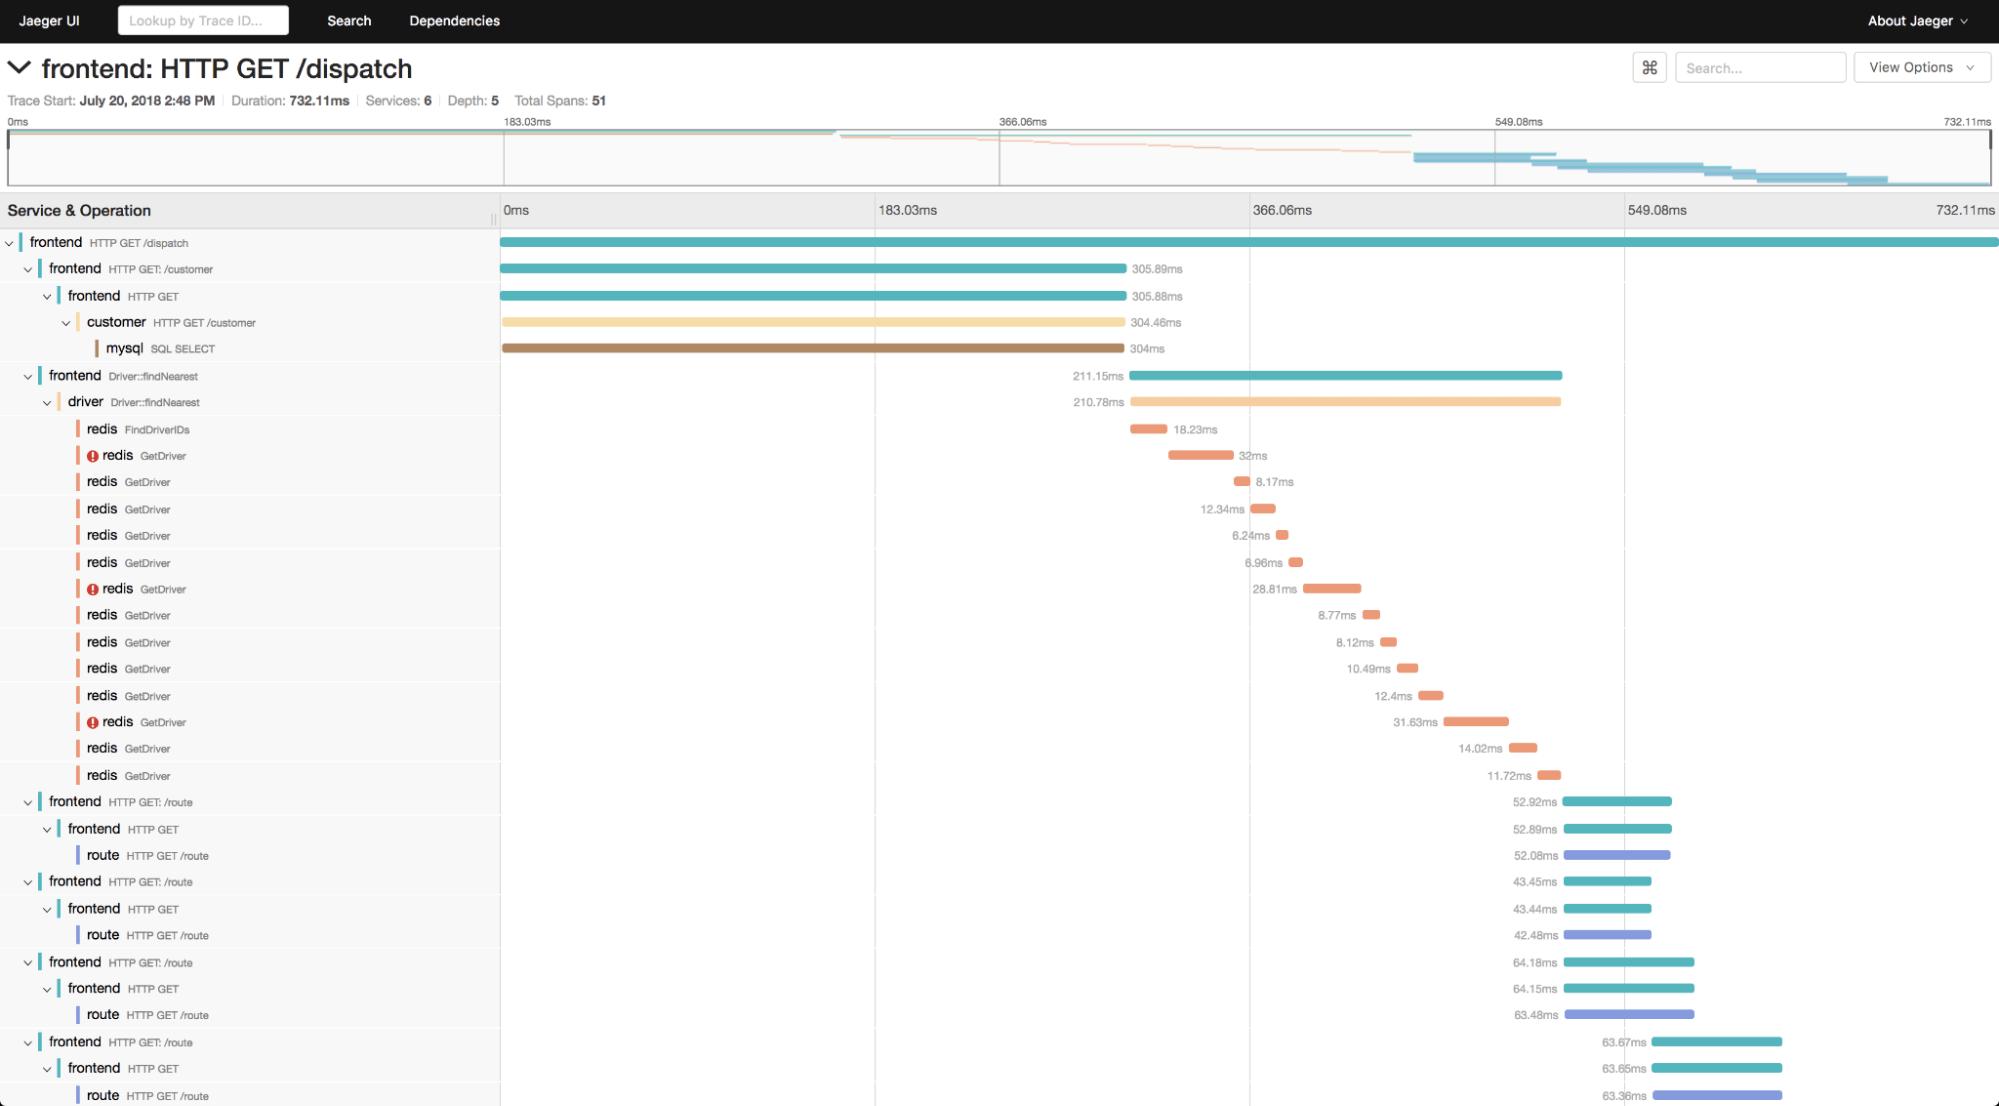
Originally released in 2016, Jaeger is an open-source project that provides a toolset for tracing and troubleshooting. For engineering teams with complex distributed systems, Jaeger makes it easy to perform distributed transaction monitoring and to perform root cause analysis. Jaeger is also helpful in that it can be used to monitor performance and latency optimization. It’s recommended that you instrument your applications using OpenTelemetry, and there is support for Java, Node, Python, Go, and C++.
While Kubernetes makes it easier to run distributed, containerized workloads, there is added complexity in handling distributed and connected compute elements. In this kind of complex setup, monitoring all critical components ensures that there are no single points of failure within a cluster.
Administering Kubernetes requires a focused approach, dedicated tools, and the right methodologies for proactive monitoring of cluster components. By enabling an efficient monitoring mechanism, organizations can not only increase cluster efficiency but also reduce operational costs while proactively managing resources at their optimum standards.
Photo by Miguel A. Amutio on Unsplash
Deploy your first virtual cluster today.
