Introducing and a Deep Dive Into Dynamo with vCluster

Jul 7, 2026
|
15
min Read

Serving LLMs on Kubernetes is rarely just "run the container." You have to pick a backend, size the GPU count, decide between aggregated and disaggregated serving, wire up a frontend and router, and keep all of it observable. Most teams solve this with tribal knowledge and hand-written manifests, and then rewrite everything when the model or the hardware changes.
NVIDIA Dynamo takes a different approach. Instead of asking you to hand-author the deployment, Dynamo lets you describe intent, a model and optionally a backend, and its operator profiles the hardware, resolves a serving topology, and reconciles the whole inference graph into running pods.
In this guide, we introduce Dynamo, explain the Kubernetes resources it is built from, and then walk through a hands-on deep dive serving Qwen/Qwen3-0.6B on a tenant cluster with vCluster Private Nodes. You will see how a three-line manifest becomes a profiled, auto-sized, production-shaped inference deployment.
Dynamo is NVIDIA's open source inference serving framework for Kubernetes, which helps with disaggregated inference. It sits above the serving engine and owns everything around it: the frontend that speaks the OpenAI-compatible API, the router that spreads requests across workers, the workers that run the actual engine, and the control loop that keeps the graph healthy.
A few things worth knowing before you deploy it:
What it is not:
Before applying the first YAML, it helps to know the Kubernetes resources Dynamo uses. These are Dynamo's native control-plane objects; you describe the inference graph, and the operator owns the Kubernetes deployments, services, and component rollout around it:
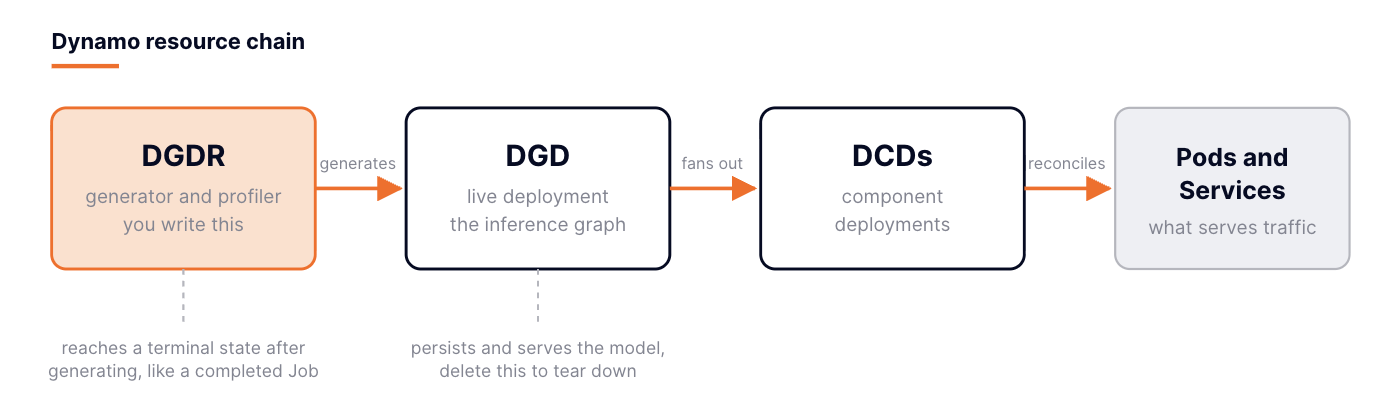
Figure 1. A DGDR generates a DGD, the DGD fans out into component deployments, and those become pods and services.
This walkthrough uses a DGDR because it avoids hand-writing the first DGD. After the DGDR generates and applies the DGD, the DGDR reaches a terminal state, similar to a Kubernetes Job. The DGD persists and serves your model.
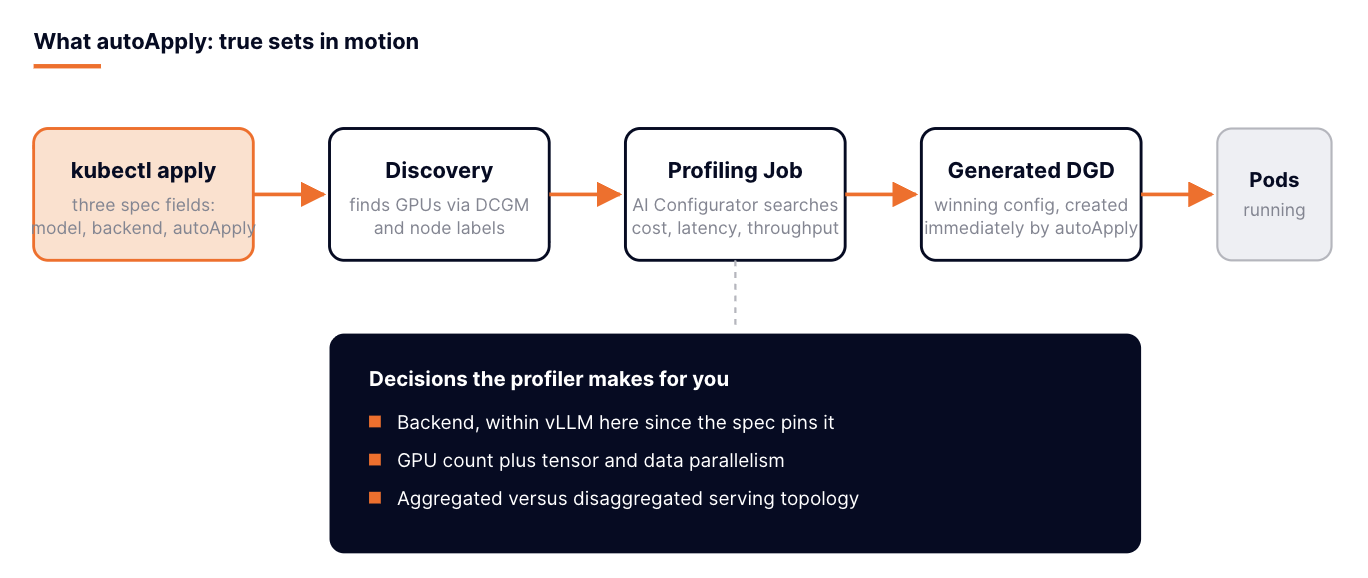
Figure 2. One apply, five stages, zero sizing decisions made by hand.
DGDR can also carry supported generated-deployment features such as features.planner for Planner configuration and features.mocker for mocker mode. KV-aware routing is not currently exposed as a DGDR feature field; use a direct DGD, a tuned recipe, or overrides.dgd when you need to set router mode or other graph-level details explicitly.
In this part of the article, we put Dynamo to work on real GPUs. The topology mirrors the AICR walkthrough: a tenant cluster whose control plane runs in vCluster Cloud, with compute joined as private nodes over the vCluster VPN. The nodes never need a public address, and the tenant cluster appears and behaves like any dedicated cluster to Dynamo.
For this demo the tenant cluster has:
Setting this up is a short detour: create the tenant cluster with privateNodes.enabled: true, mint a join token with vcluster token create, and run the printed script on each node. The node installs kubelet and containerd, joins over the tunnel, and shows up in kubectl get nodes like any other worker. We covered the full workflow, including join tokens, upgrades, and the gotchas, in Running Dedicated Clusters with vCluster: A Deep Dive into Private Nodes, so this post picks up where that one ends.

Figure 3. The demo topology: a control plane in vCluster Cloud, compute joined over an encrypted tunnel.
Once the nodes are joined, connect to the tenant cluster through the platform:
vcluster platform connect vcluster dynamo --project marketing
The CLI confirms the context switch:
14:12:19 done Switched active kube context to vcluster-platform_dynamo_marketing_gke_hrittik-project_us-east1_cluster-1
- Use `vcluster disconnect` to return to your previous kube context
- Use `kubectl get namespaces` to access the vcluster
From here on, everything is plain kubectl and helm. That is the point of the private node model: the GPUs are wherever you found them, and the cluster is just a cluster.
Dynamo needs the GPUs visible to Kubernetes, so the GPU Operator goes in first. It handles the device plugin, the container toolkit, DCGM metrics, and validation in one chart:
helm repo add nvidia https://helm.ngc.nvidia.com/nvidia --force-update
helm repo update nvidia
helm install gpu-operator nvidia/gpu-operator \
  --namespace gpu-operator --create-namespace \
  --wait --timeout=600s
Helm walks through the repo update and confirms the release:
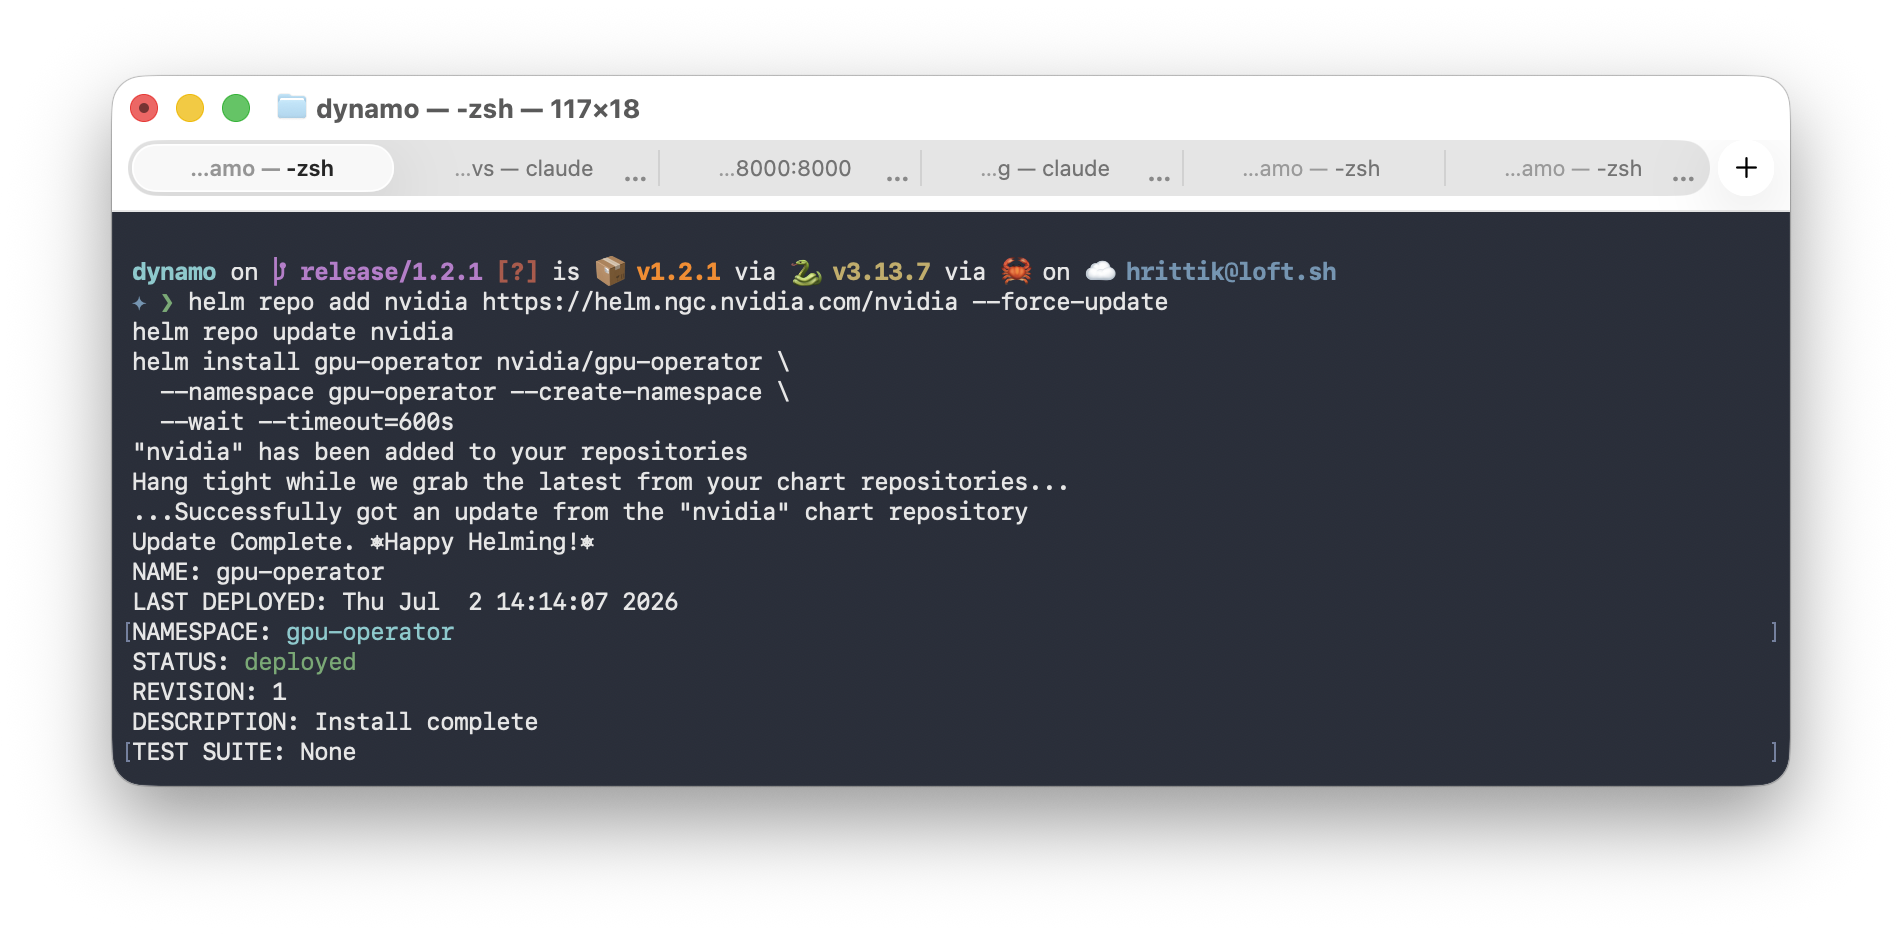
Give it a couple of minutes and check the rollout. The -o wide view is worth a look because it shows the operator doing the right thing with node placement.
kubectl get pods -n gpu-operator -o wide
GPU-specific daemonsets land only on the GPU node, while the operator and discovery components sit on the CPU node:
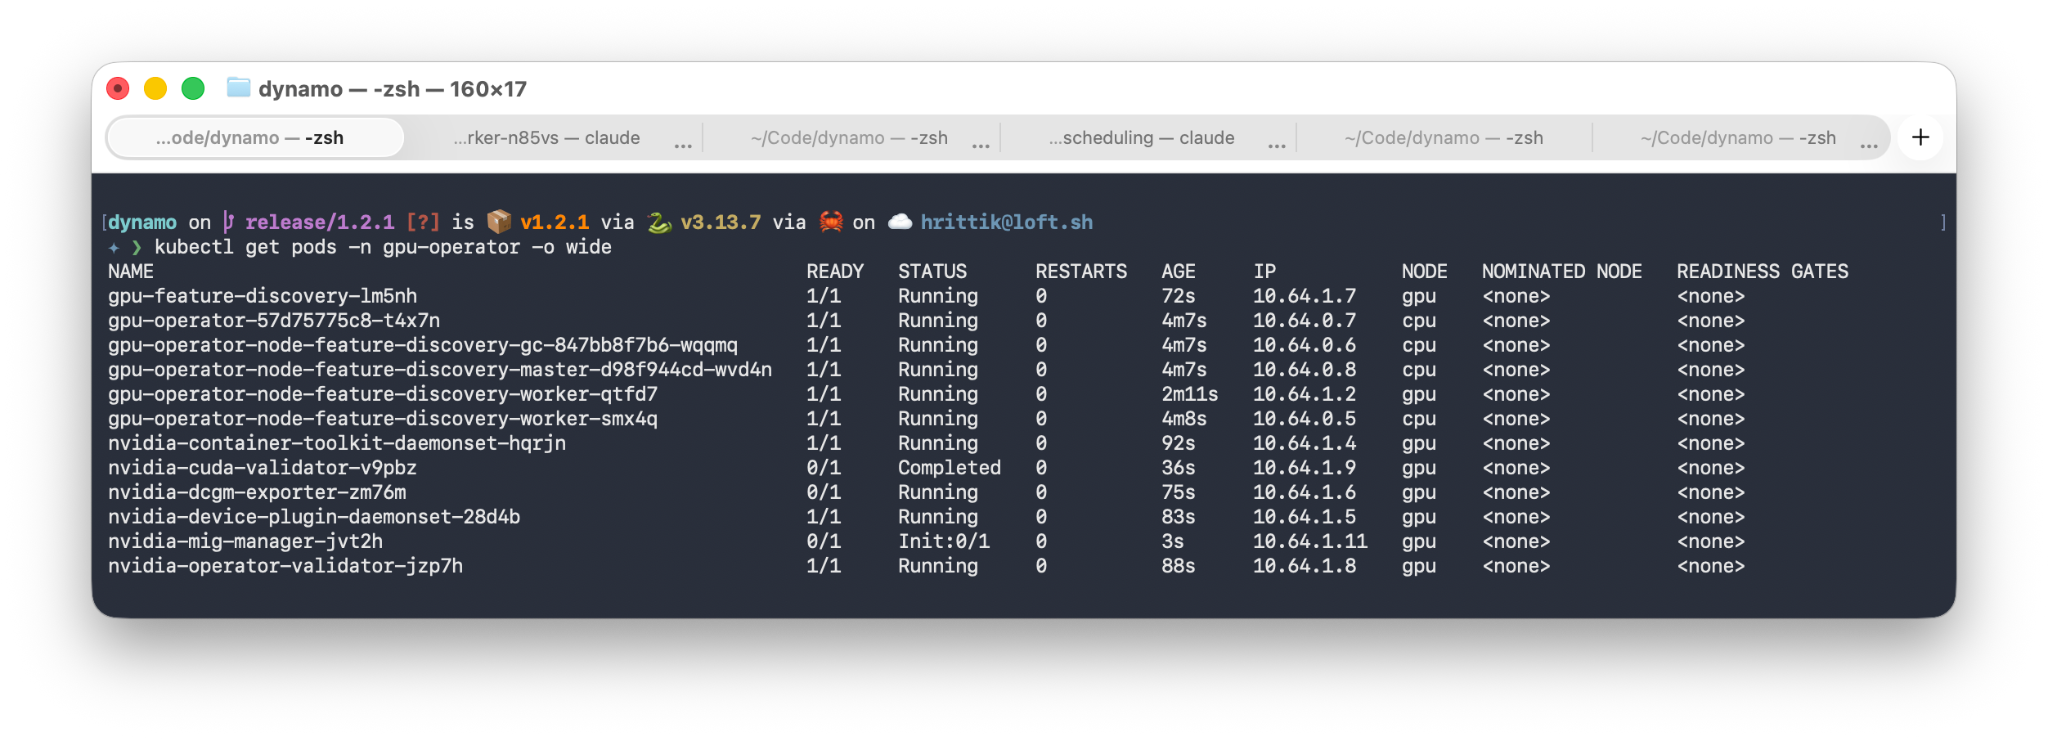
The nvidia-cuda-validator pod reaching Completed is your green light: the operator ran a real CUDA workload on the node and it passed.
The workers pull model weights from Hugging Face, so export a token and create a secret in the namespace you will deploy into:
export HF_TOKEN=hf_xxxxxxxxxxxxxxxxxxxxxxxx
kubectl create secret generic hf-token-secret \
  --from-literal=HF_TOKEN="$HF_TOKEN"
Kubernetes confirms the secret:
secret/hf-token-secret created
Dynamo's profiler and planner consume Prometheus metrics, so install the stack before the platform and open up the selectors so Dynamo's PodMonitors get picked up across namespaces:
helm repo add prometheus-community https://prometheus-community.github.io/helm-charts
helm repo update
helm install prometheus prometheus-community/kube-prometheus-stack \
  --namespace monitoring --create-namespace \
  --set prometheus.prometheusSpec.podMonitorSelectorNilUsesHelmValues=false \
  --set-json 'prometheus.prometheusSpec.podMonitorNamespaceSelector={}' \
  --set-json 'prometheus.prometheusSpec.probeNamespaceSelector={}'
Now the platform itself. Set the release version, fetch the chart from NGC, and install it with Grove and the KAI Scheduler enabled, pointing the operator at the Prometheus endpoint from the previous step:
export NAMESPACE=dynamo-system
export RELEASE_VERSION=1.2.1
helm fetch https://helm.ngc.nvidia.com/nvidia/ai-dynamo/charts/dynamo-platform-$RELEASE_VERSION.tgz
helm install dynamo-platform dynamo-platform-$RELEASE_VERSION.tgz \
  --namespace $NAMESPACE \
  --create-namespace \
  --set "global.grove.install=true" \
  --set "global.kai-scheduler.install=true" \
  --set "dynamo-operator.dynamo.metrics.prometheusEndpoint=http://prometheus-kube-prometheus-prometheus.monitoring.svc.cluster.local:9090"
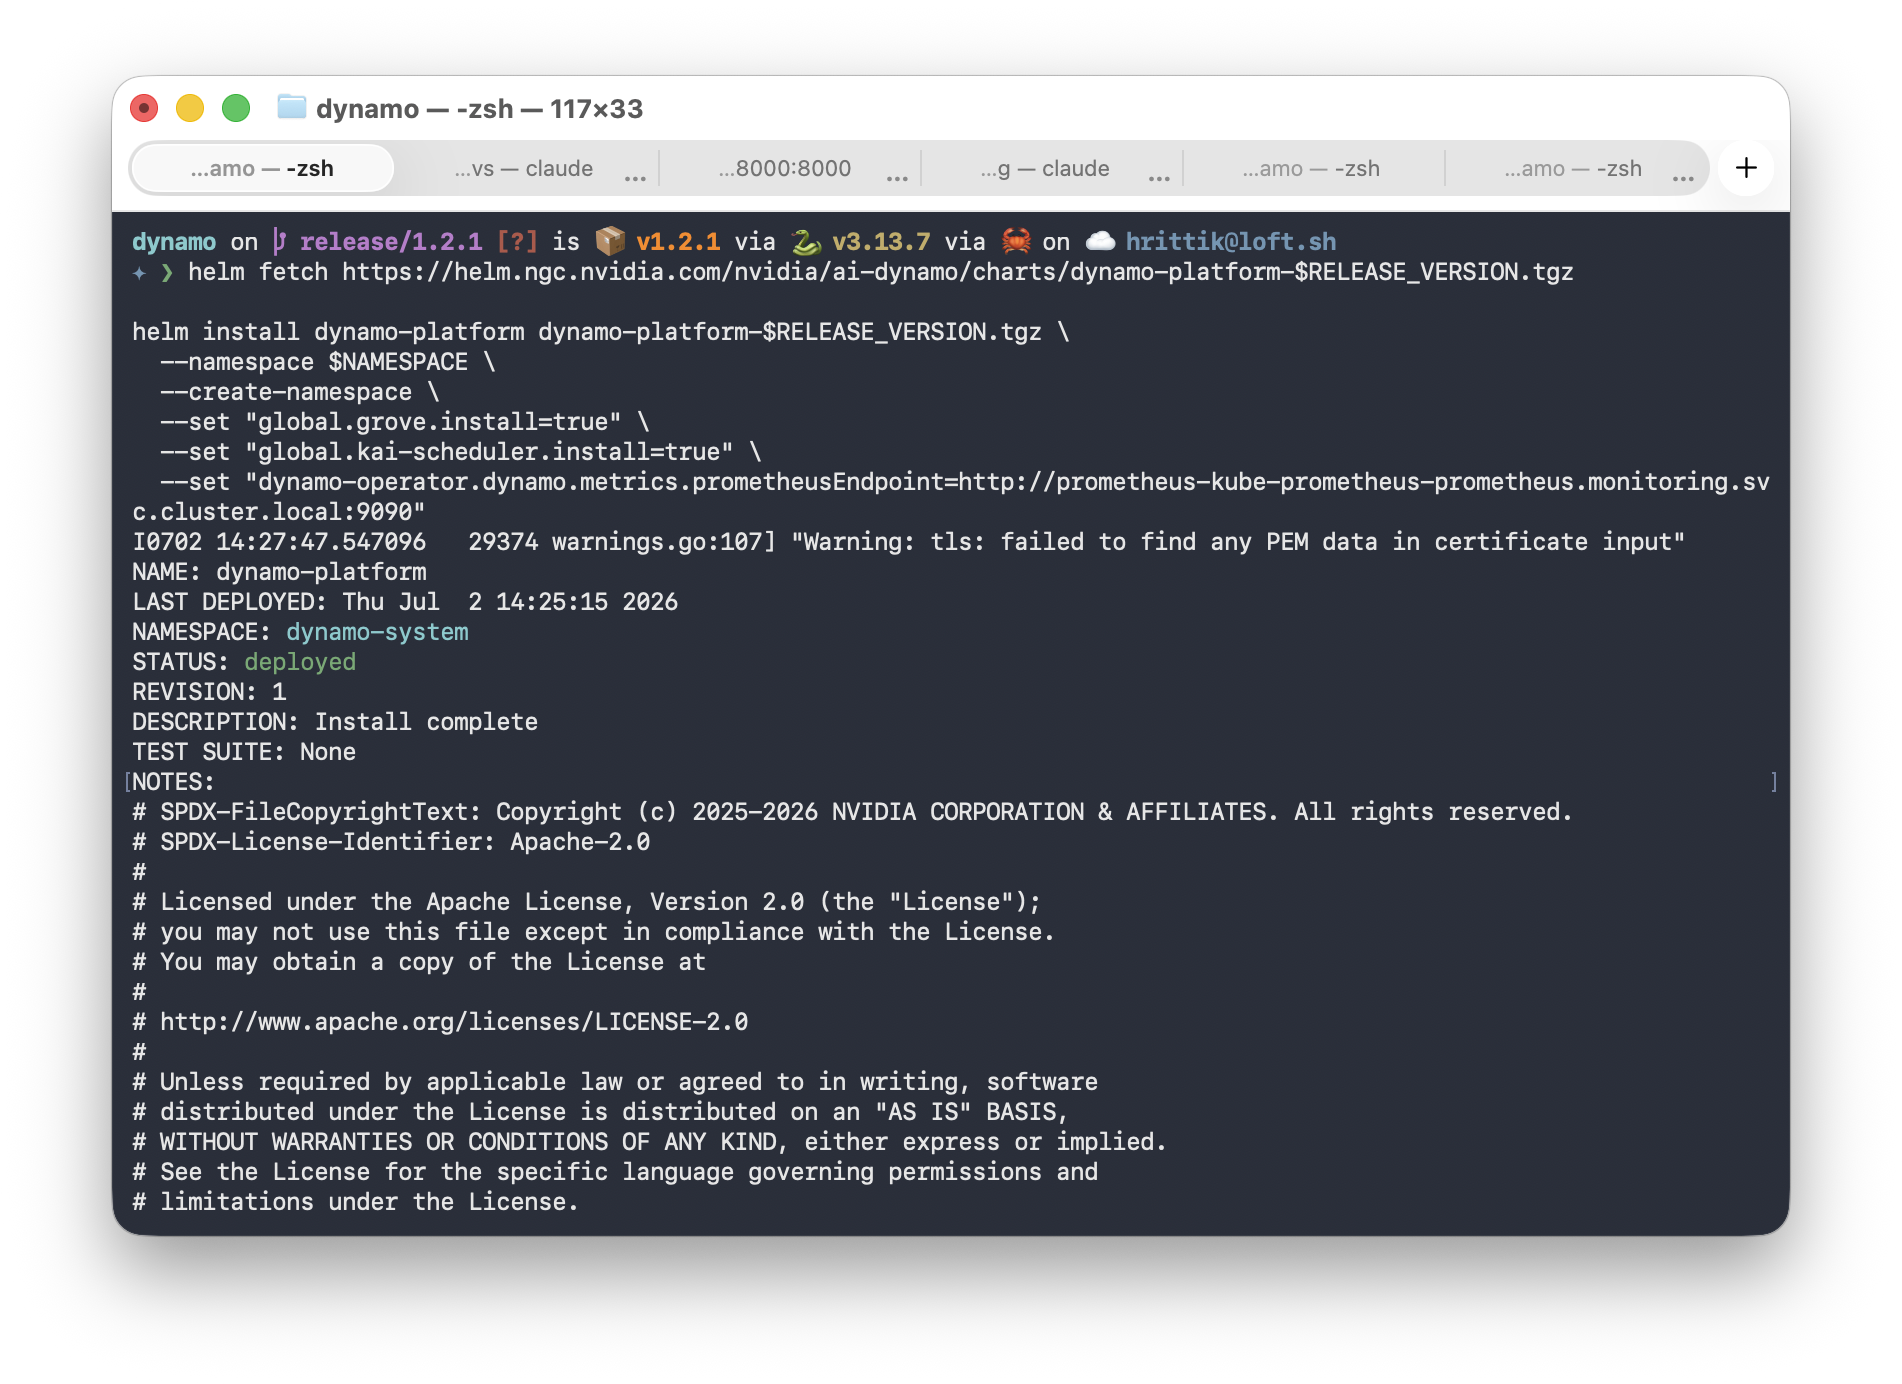
After a few minutes, Helm reports the release deployed:
I0702 14:27:47.547096 29374 warnings.go:107] "Warning: tls: failed to find any PEM data in certificate input"
NAME: dynamo-platform
LAST DEPLOYED: Thu Jul 2 14:25:15 2026
NAMESPACE: dynamo-system
STATUS: deployed
REVISION: 1
DESCRIPTION: Install complete
TEST SUITE: None
The TLS warning is harmless; webhook certificates settle as the release reconciles. The chart also prints its Apache 2.0 license header in the NOTES, trimmed here for readability.
Verify the CRDs landed. This is the vocabulary from the resources section, now live in the cluster:
kubectl get crd | grep dynamo
Once successfully done, all seven Dynamo CRDs should be present:
dynamocheckpoints.nvidia.com 2026-07-02T08:54:48Z
dynamocomponentdeployments.nvidia.com 2026-07-02T08:54:51Z
dynamographdeploymentrequests.nvidia.com 2026-07-02T08:54:54Z
dynamographdeployments.nvidia.com 2026-07-02T08:54:58Z
dynamographdeploymentscalingadapters.nvidia.com 2026-07-02T08:54:59Z
dynamomodels.nvidia.com 2026-07-02T08:55:00Z
dynamoworkermetadatas.nvidia.com 2026-07-02T08:55:01Z
And check the control plane pods. You get the Dynamo operator, NATS, Grove, and the full KAI Scheduler stack. Grove and KAI are not required for a small single-node model like the one in this demo, but we are building a setup that carries forward: when you move to multi-node inference, Grove handles the multi-node orchestration and KAI provides the gang scheduling, and having them installed now means that jump is a manifest change, not a platform reinstall:
kubectl get pods -n $NAMESPACE
Now you can see all of your pods, here:
NAME READY STATUS RESTARTS AGE
admission-6b9c947697-9jvfl 1/1 Running 0 4m17s
binder-7878566844-s26ws 1/1 Running 0 4m18s
dynamo-platform-dynamo-operator-controller-manager-7f7db79h7vvc 1/1 Running 1 (95s ago) 4m59s
dynamo-platform-nats-0 2/2 Running 0 4m59s
grove-operator-845b95cbfb-hvv9k 1/1 Running 1 (4m40s ago) 4m59s
kai-operator-7f44d4bb8b-tfksv 1/1 Running 0 4m59s
kai-scheduler-default-cb45f9bbb-ms9bs 1/1 Running 0 4m20s
pod-grouper-5969dc5bc7-79x7x 1/1 Running 0 4m19s
podgroup-controller-66b85fc869-bbpwr 1/1 Running 0 4m17s
queue-controller-7b6767bf9f-7pwq9 1/1 Running 0 4m17s
A restart or two on the operator while CRDs and webhooks settle is normal, and you can see exactly that in the RESTARTS column. Once everything reads Running, the platform is ready to accept work.
Here is the entire deployment manifest:
cat qwen-demo.yaml
apiVersion: nvidia.com/v1beta1
kind: DynamoGraphDeploymentRequest
metadata:
  name: qwen-vllm
spec:
  model: Qwen/Qwen3-0.6B
  backend: vllm
  autoApply: true
Three spec fields. No replica counts, no GPU requests, no image tags, no frontend or router wiring. It is worth slowing down here, because what happens after kubectl apply is the most interesting part of Dynamo.
Apply it and watch the sequence play out:
kubectl apply -f qwen-demo.yaml
kubectl get pods
Seconds after applying, the profiling pod appears:
NAME READY STATUS RESTARTS AGE
profile-qwen-vllm-cn47c 0/2 ContainerCreating 0 3s
First the profiling Job. Check a couple of minutes later:
kubectl get pods
The Job completes and the generated DGD starts rolling out the actual graph:
NAME READY STATUS RESTARTS AGE
profile-qwen-vllm-cn47c 0/2 Completed 0 119s
qwen-vllm-dgd-0-frontend-jqnqc 0/1 ContainerCreating 0 37s
qwen-vllm-dgd-0-vllmdecodeworker-b2xf8 0/1 ContainerCreating 0 32s
qwen-vllm-dgd-0-vllmdecodeworker-bv8bf 0/1 ContainerCreating 0 33s
qwen-vllm-dgd-0-vllmdecodeworker-pwdsv 0/1 ContainerCreating 0 31s
qwen-vllm-dgd-0-vllmdecodeworker-sxhh5 0/1 ContainerCreating 0 36s
The profiler decided this cluster serves Qwen3-0.6B best with a frontend plus four vLLM decode workers. We wrote none of that.
Those workers will sit in ContainerCreating for a while, and it is worth knowing why. The nvcr.io/nvidia/ai-dynamo/vllm-runtime:1.2.1 image is about 12.95 GB compressed on the wire, spread across 55 layers. Gzip-compressed layers for CUDA and PyTorch-heavy images typically expand two to three times on extraction, so expect roughly 25 to 35 GB on the node's disk before the container even starts. Add model weights on top.
This is exactly why the nodes were provisioned with 300 GB of storage. The first pull on each node is slow; subsequent deployments on the same node reuse the cached image and start in seconds. There are ways to cache the image, like by using a Job and PV, but for now, we can wait:
kubectl get pods
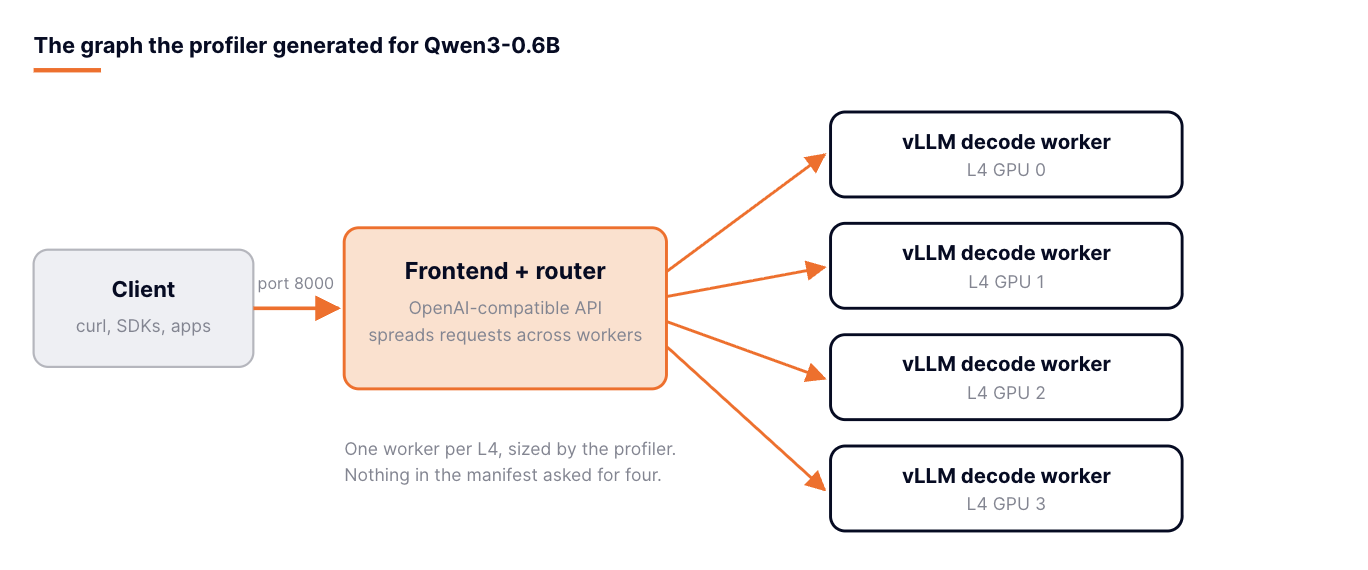
Figure 4. The generated graph: a frontend plus one vLLM decode worker per L4.
Once the image lands, the whole graph reports Running:
NAME READY STATUS RESTARTS AGE
profile-qwen-vllm-cn47c 0/2 Completed 0 27m
qwen-vllm-dgd-0-frontend-8vt8v 1/1 Running 0 8m16s
qwen-vllm-dgd-0-vllmdecodeworker-b2xf8 1/1 Running 0 26m
qwen-vllm-dgd-0-vllmdecodeworker-bv8bf 1/1 Running 0 26m
qwen-vllm-dgd-0-vllmdecodeworker-pwdsv 1/1 Running 0 26m
qwen-vllm-dgd-0-vllmdecodeworker-sxhh5 1/1 Running 0 26m
The operator also created the Services for the graph:
kubectl get svc
Note the frontend on port 8000:
NAME TYPE CLUSTER-IP EXTERNAL-IP PORT(S) AGE
kubernetes ClusterIP 10.128.0.1 <none> 443/TCP 94m
qwen-vllm-dgd-0 ClusterIP None <none> <none> 28m
qwen-vllm-dgd-frontend ClusterIP 10.128.133.210 <none> 8000/TCP 28m
qwen-vllm-dgd-vllmdecodeworker ClusterIP 10.128.157.183 <none> 9090/TCP 28m
Port-forward the frontend:
kubectl port-forward svc/qwen-vllm-dgd-frontend 8000:8000
kubectl confirms the tunnel:
Forwarding from 127.0.0.1:8000 -> 8000
Forwarding from [::1]:8000 -> 8000
Then, from another terminal, hit the OpenAI-compatible endpoint:
curl -s http://localhost:8000/v1/chat/completions \
  -H "Content-Type: application/json" \
  -d '{
  "model": "Qwen/Qwen3-0.6B",
  "messages": [
    {
      "role": "user",
      "content": "What is Kubernetes?"
    }
  ],
  "max_tokens": 200
}' | python3 -m json.tool
The model answers, thinking tokens and all:
{
  "id": "chatcmpl-8ecb6ad3-763d-4613-8c01-c015ab3485a6",
  "choices": [
    {
      "index": 0,
      "message": {
        "content": "<think>\nOkay, the user is asking what Kubernetes is. Let me start by explaining it briefly. I know Kubernetes is a system that automates the deployment, scaling, and management of containerized applications. But I should make sure to define it accurately.\n\nFirst, I should mention that Kubernetes is an open-source platform developed by Google. It's designed to manage containers in a way that's efficient and scalable. I need to highlight key features like auto-scaling, load balancing, and rolling updates.\n\nWait, maybe I should also mention its adoption in cloud environments, especially in container orchestration. Oh right, Kubernetes is used in various industries, not just tech companies. That's a good point to include.\n\nI should avoid technical jargon and keep the explanation simple. Maybe start with a definition, then break down the main components, and mention its benefits. Also, note that it's an open-source project, which adds a bit of context about its community and development.\n\nLet me check if there",
        "role": "assistant",
        "reasoning_content": null
      },
      "finish_reason": "length",
      "logprobs": null
    }
  ],
  "created": 1782987349,
  "model": "Qwen/Qwen3-0.6B",
  "service_tier": null,
  "system_fingerprint": null,
  "object": "chat.completion",
  "usage": {
    "prompt_tokens": 12,
    "completion_tokens": 200,
    "total_tokens": 212
  }
}
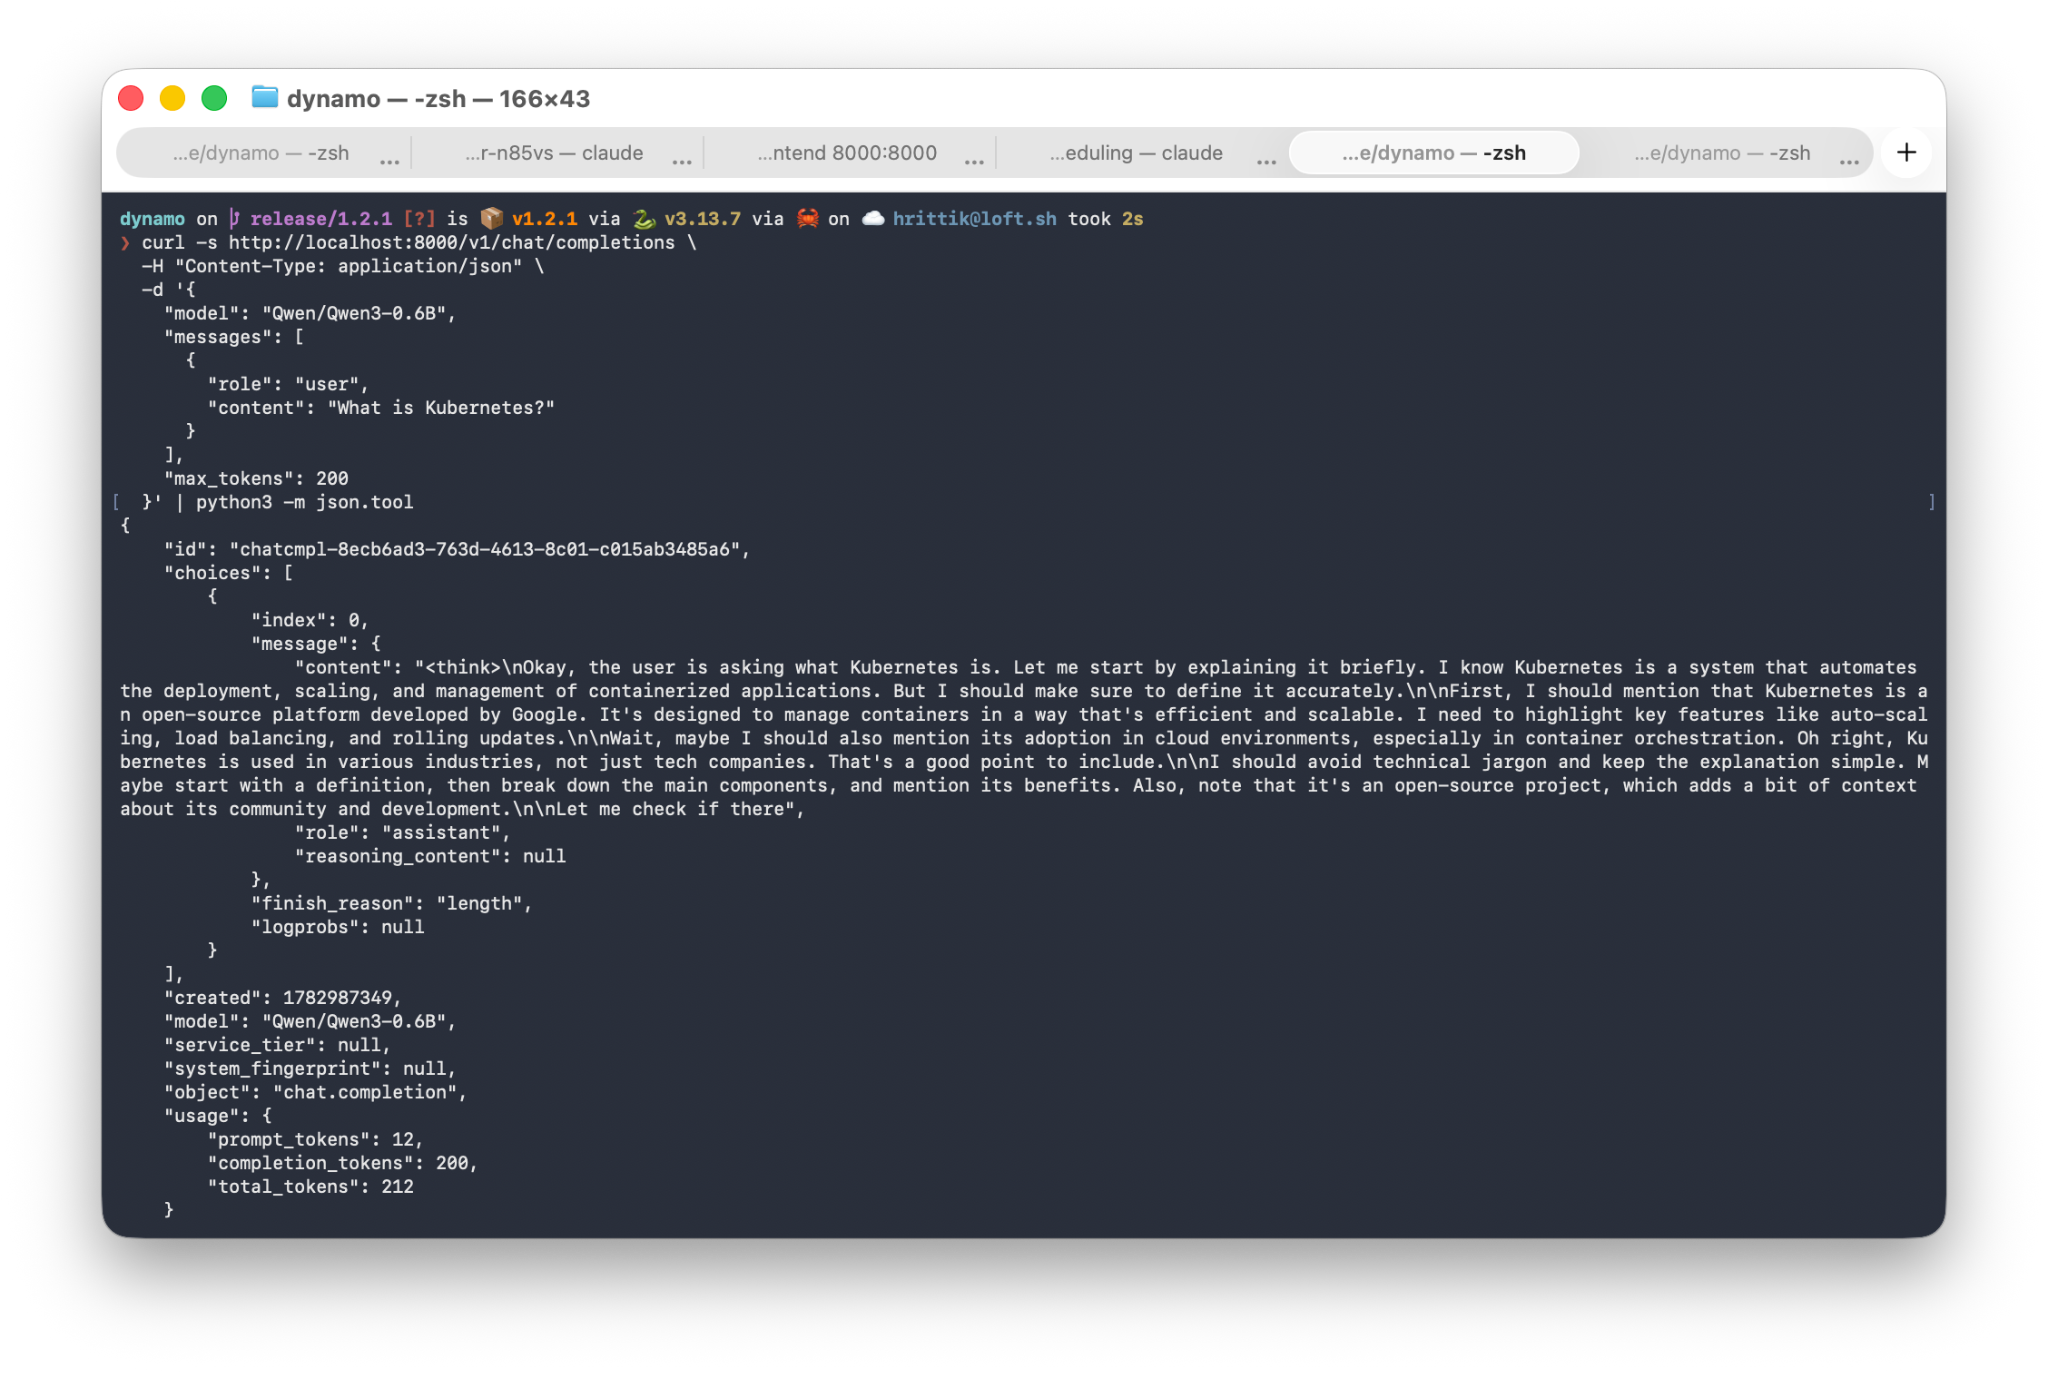
A reasoning model, profiled, sized, deployed, and answering questions about Kubernetes from inside a tenant cluster. The DGD confirms the graph is healthy:
kubectl get dynamographdeployment -n default
One object, one healthy graph:
NAME READY BACKEND AGE
qwen-vllm-dgd True 34m
Teardown follows the same ownership chain in reverse. Delete the DGD and the operator reconciles away the component deployments, pods, and services it created:
kubectl delete dynamographdeployment qwen-vllm-dgd -n default
The operator tears down everything the DGD owned:
dynamographdeployment.nvidia.com "qwen-vllm-dgd" deleted from default namespace
The completed profiling pod can go too:
kubectl delete pod profile-qwen-vllm-cn47c
And it is gone:
pod "profile-qwen-vllm-cn47c" deleted from default namespace
Note that we delete the DGD, not the DGDR. The request already did its job and reached a terminal state; the live deployment is what holds the resources.
The real shift is the same one AICR makes for cluster configuration, applied to inference. A hand-written deployment makes a person hold every sizing decision: backend, parallelism, worker count, topology. Dynamo moves that work into a controller that profiles the hardware you actually have, and everything downstream is reconciliation. The DGDR generates, the DGD serves, the operator repairs. When you outgrow the generated deployment, tuned recipes and direct DGD specs give you full control without leaving the same resource model.
vCluster is a natural home for this. Private nodes let you attach GPU capacity from anywhere over an encrypted tunnel, tenant clusters give each team or workload a clean control plane to run the full Dynamo stack without stepping on anyone else, and adding a second GPU node when the profiler wants more room is a join token, not a procurement cycle. Dynamo assumes the cluster underneath it is dynamic; vCluster makes it so.
If you try this and have questions, or want to show off what the profiler picked for your hardware, join us on Slack.
Deploy your first virtual cluster today.
