Managing NVKE clusters across Sites with vCluster Platform

Nov 10, 2026
|
12
min Read

NVIDIA Kubernetes Engine (NVKE) lets you run a managed Kubernetes service on your own NVIDIA bare-metal infrastructure. It handles cluster creation, node identity, upgrades, and replacement, giving teams a consistent Kubernetes foundation on the hardware you own.
Once those clusters are running, how do you manage access across sites, deliver the applications teams need, and see where capacity is being used? In this guide, we will connect three NVKE sites to vCluster Platform and inspect them from one place, then dive deep into what Platform makes possible on top of that fleet with Stacks and Fleet Observability.
For this walkthrough, we mock the installation and underlying hardware with mock-NICo on Google Compute Engine VMs. These VMs have no GPUs, so the hands-on steps cover what runs on them: launching the sites, connecting them to Platform, and exploring the connected fleet. For the GPU-dependent parts, we explain how each capability works using screens from earlier walkthroughs and link to them for the end-to-end run. On physical NVKE sites, the same connection workflow applies, with provisioning and runtime configuration matched to that hardware.
NVKE turns a request through its API or nvkectl into a working Kubernetes environment, coordinating provisioning and lifecycle operations. Each team gets a repeatable starting point instead of a cluster assembled differently at every site.
Each site has a management cluster that runs the NVKE API and controllers. It creates workload clusters with their own Kubernetes control planes, etcd, and nodes. Follow the provisioning path below: the management cluster asks NICo, the NVIDIA Infra Controller, for machines, and node attestation happens before they join.
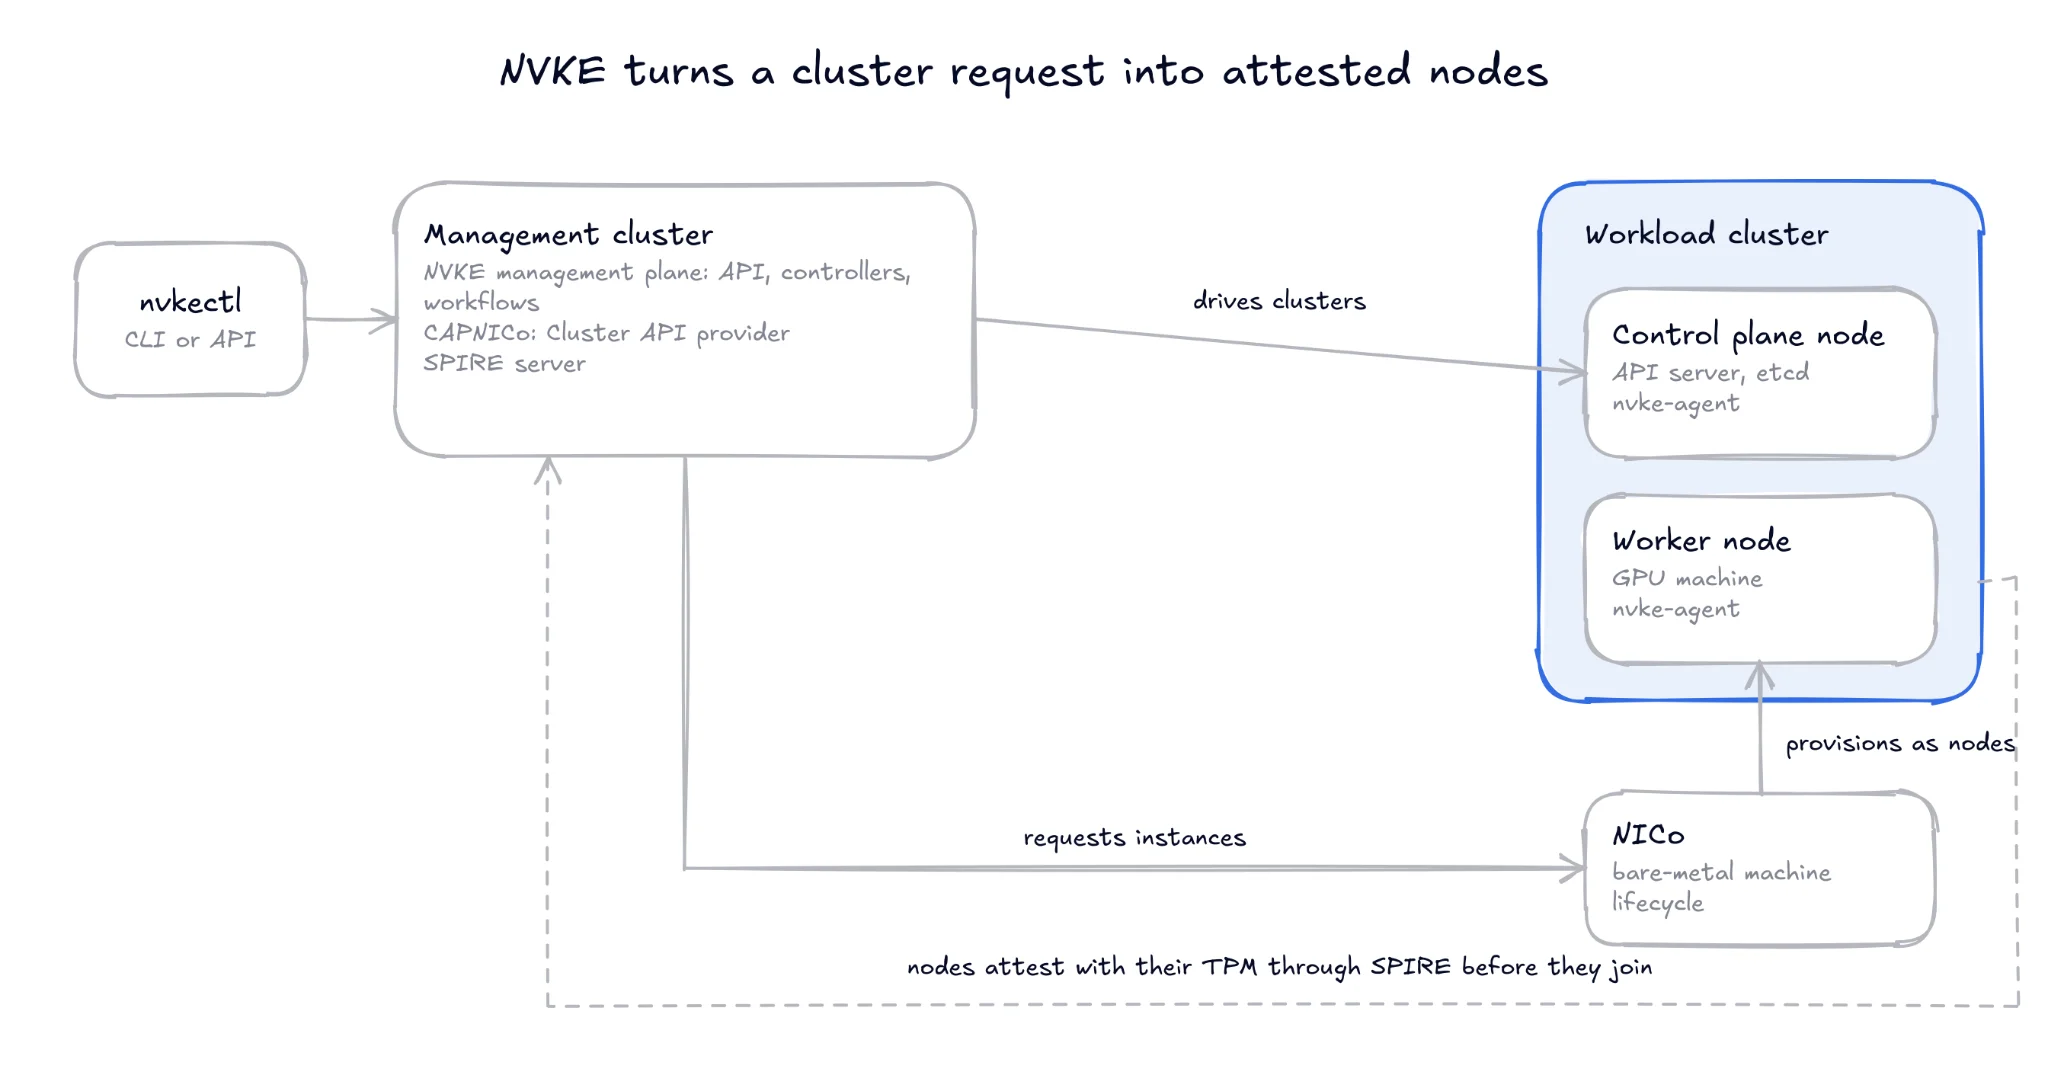
Figure 1: NVKE coordinates provisioning and node identity; the resulting workload cluster runs the team's applications.
On GPU infrastructure, AICR resolves hardware-appropriate, version-locked runtime components and validates them against the environment. NVKE can also respond to GPU faults reported by NVSentinel. This reduces per-cluster compatibility work and connects GPU health to node recovery. NVKE is currently a preview; evaluate its lifecycle behavior before relying on it for production.
For a hands-on look at runtime configuration and validation, see my earlier post, Introducing and a Deep Dive Into AICR with vCluster.
With these responsibilities clear, we can create the sites that Platform will manage together.
We will create three independent NVKE sites, one each in the US, Europe, and Asia. The launcher gives every site its own configuration and state, so repeating the setup for another region follows the same steps. On physical infrastructure, NVKE uses NICo to provision the machines; the steps below give us the cluster APIs we need to follow the rest of the guide.
Before starting, authenticate the Google Cloud CLI and select a project with billing, the Compute Engine API, sufficient VM and disk quota, and SSH access. You will also need Bash, Python 3, tar, and permission to run sudo on the VM. We use Ubuntu 24.04 with 12 vCPUs, 24 GiB of memory, and a 400 GB balanced persistent disk per site to leave comfortable headroom for repeatable setup and benchmarking work. This is our chosen setup, rather than a minimum requirement; you can use a smaller configuration that meets the NVKE quickstart requirements for a simpler evaluation.
The launcher and site configurations are in the nvke-vcluster-host repository.
git clone https://github.com/hrittikhere/nvke-vcluster-host.git
cd nvke-vcluster-host
Set NVKE_PROJECT in config.env to your project, then inspect the plan before creating the first site:
./nvke-gcp.sh plan
./nvke-gcp.sh up
Once you run the launcher, it installs the tools, builds NVKE from the pinned checkout, starts the management plane, and creates a workload cluster. It also configures a default storage class and metrics-server so the cluster can provision volumes and report resource usage. Setup runs as a systemd job, so a laptop disconnect does not stop the installation. To follow its progress again, run:
./nvke-gcp.sh wait
The other two sites use the same workflow with separate names, state directories, and tunnel ports:
NVKE_CONFIG=sites/eu-west4.env ./nvke-gcp.sh up
NVKE_CONFIG=sites/asia-southeast1.env ./nvke-gcp.sh up
Before connecting a site, check that NVKE has provisioned it and that Kubernetes has usable nodes and storage:
./nvke-gcp.sh status
./nvke-gcp.sh kubectl get nodes -o wide
./nvke-gcp.sh kubectl get storageclass
On the VM, these commands wrap nvkectl and kubectl, so you can also run them directly against the site. Here is what one site reported shortly after provisioning:
$ nvkectl get providers
PROVIDER     STATE          REPLICAS  CREDENTIALS  LAST CHECK  DETAIL
nico         CONFIGURED     1/1       UNSUPPORTED  -           the provider does not serve NicoIdentity (no established CRD nicoidentities.infrastructure.cluster.x-k8s.io)
launchlayer  NOT-INSTALLED  -         -            -           no established CRD launchlayerclusters.infrastructure.cluster.x-k8s.io

$ nvkectl get clusters
NAME     KUBERNETES VERSION  CNI             STATUS       ID                                    AGE
nvke-us  1.34.8              ovn-kubernetes  Provisioned  2aa7bb77-f967-4864-8a8a-ea0e3f6b892d  8m

$ kubectl get nodes
NAME                           STATUS  ROLES          AGE   VERSION
controller-capi-control-plane  Ready   control-plane  104m  v1.37.0
The providers list shows mock-NICo registered as the nico provider. Its credentials show as UNSUPPORTED because the mock does not serve NicoIdentity, which is expected here; on physical infrastructure, NICo handles that node identity step. The launchlayer provider is not installed and is not used in this setup. The cluster entry shows the workload cluster reaching Provisioned about eight minutes after creation, running Kubernetes 1.34.8 with OVN-Kubernetes as the CNI. The final command runs against the management cluster, so it lists the single control plane node that hosts the NVKE API and controllers. The workload cluster's own nodes come from the kubectl wrapper above.
Once provisioning completes, you should see NVKE report the cluster as Provisioned and Kubernetes report both nodes as Ready. With the configuration used here, each site has one control plane node and one worker. The three sites appear as follows:
| Site | Zone | Platform name | Verification |
|---|---|---|---|
| US | us-central1-a | nvke-us | Provisioned; 2/2 Ready |
| Europe | europe-west4-a | nvke-eu-west | Provisioned; 2/2 Ready |
| Asia | asia-southeast1-b | nvke-asia | Provisioned; 2/2 Ready |
Before moving on, confirm that each cluster also has a default storage class. For GPU-backed environments, select storage that meets the workload's capacity, performance, and access-mode requirements. We now have three usable clusters, ready to connect to the same Platform instance.
With the three NVKE clusters created, we can connect them to vCluster Platform. This gives the central platform team one place to manage access and inspect resources across regions.
Access control is the first thing this changes. NVKE hands you one kubeconfig per cluster, and passing that file around means every team shares the same credential, with no way to scope it or take it back. With the cluster connected, that kubeconfig stays with the platform team, and Platform gives each team scoped, revocable access instead: people sign in through SSO, and RBAC defines what they can see and do on each site.
Platform lists connected clusters under Control Plane Clusters. Here, the connected cluster is the NVKE workload cluster we just created, and the NVKE management cluster continues to handle provisioning underneath it.
The connection starts inside each NVKE workload cluster. Its Platform agent opens an outbound connection, allowing Platform to reach the private Kubernetes API through the agent without exposing that API publicly.
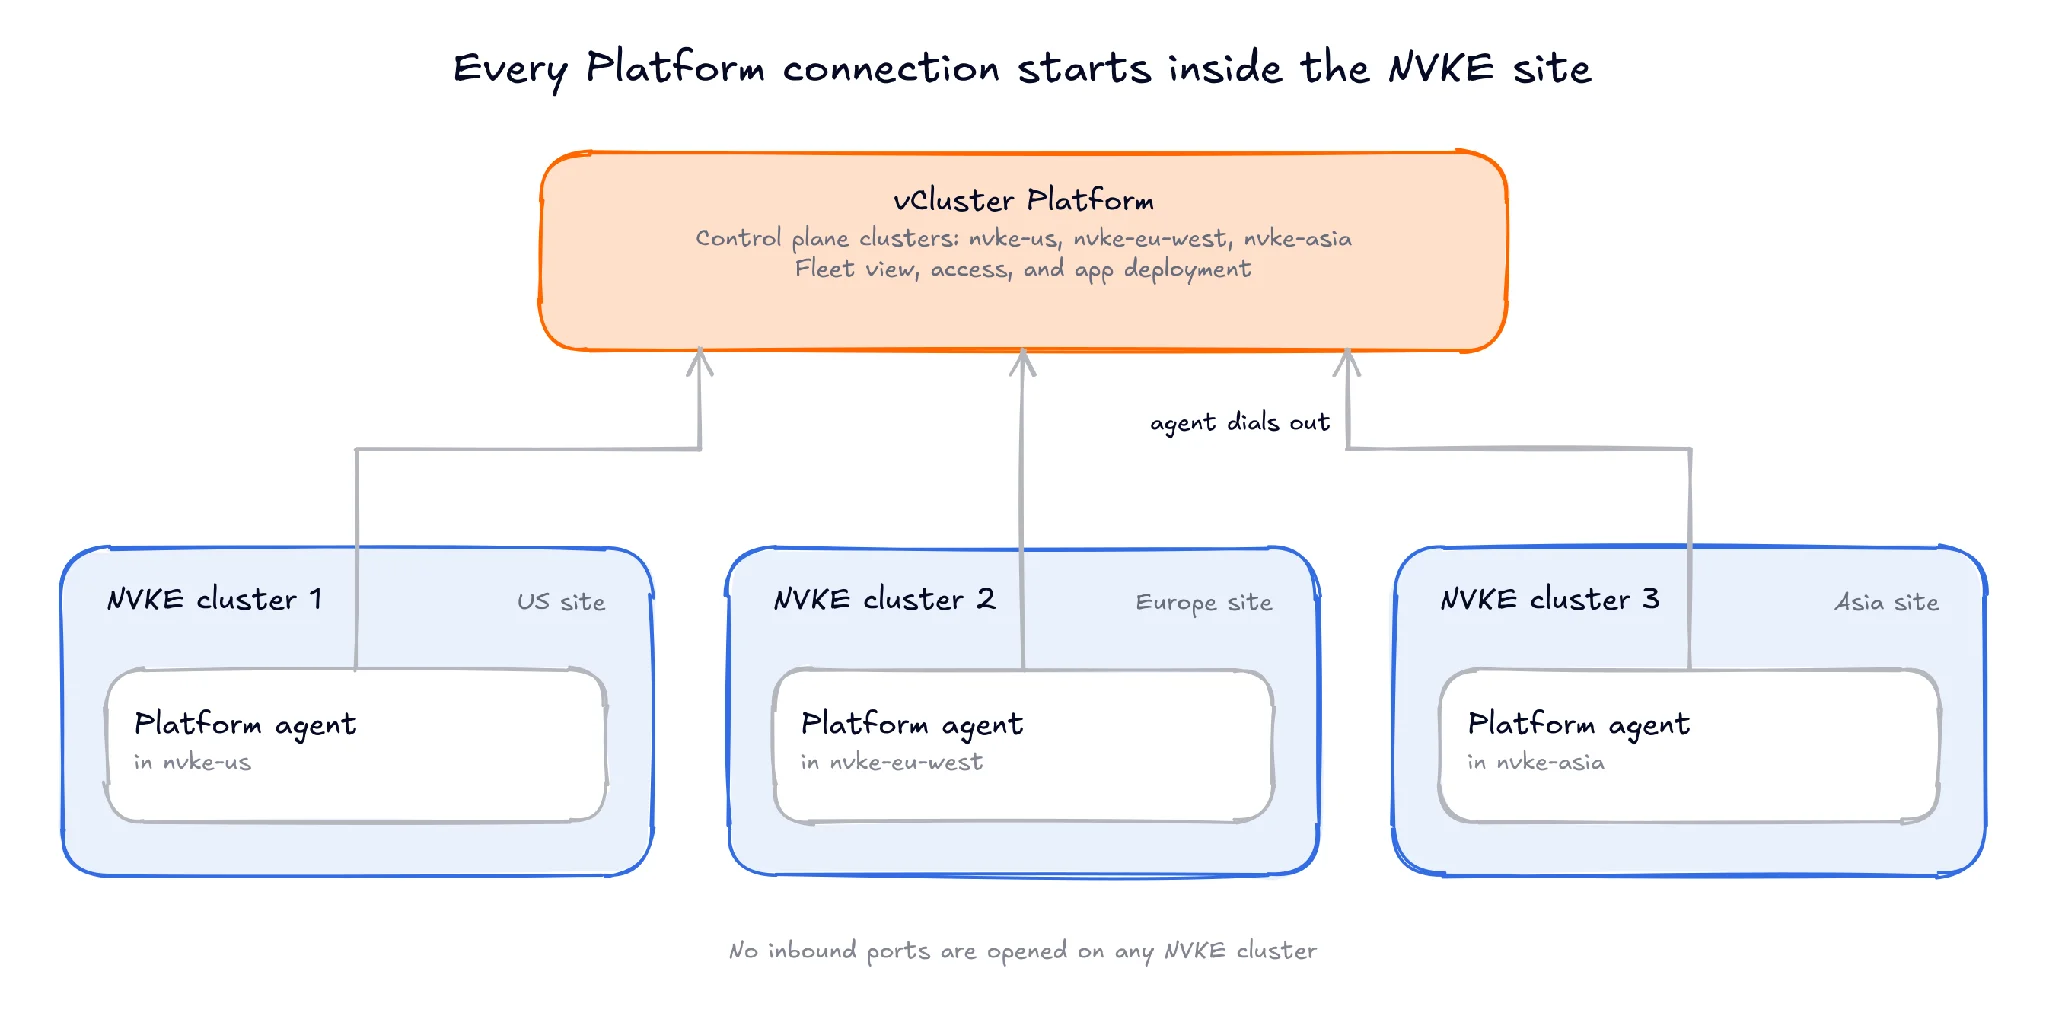
Figure 2: Each site connects outward to the same Platform instance while keeping its NVKE installation independent.
Open a tunnel to the US site and leave that terminal running:
./nvke-gcp.sh tunnel
In another terminal, authenticate to your Platform instance and add the cluster using the kubeconfig exported by the launcher:
vcluster platform login https://YOUR_PLATFORM_HOST
KUBECONFIG="$PWD/.state/workload.local.json" \
  vcluster platform add cluster nvke-us --display-name "nvke-us"
Repeat the tunnel and add-cluster steps for Europe and Asia using their site configurations, exported kubeconfig paths, and Platform names from the table. Each site uses separate local ports, so the tunnels can run together. If you use the Connect Cluster dialog instead, keep the login step before its generated connection command.
vcluster platform list clusters
./nvke-gcp.sh kubectl get pods -n vcluster-platform
Once the connection succeeds, the cluster list should include all three sites and the agent check should show a running Platform agent in each cluster. We can now move into the UI to verify the same result and inspect a site's resources.
Open Infrastructure > Control Plane Clusters. You should see all three NVKE sites as Connected. This gives administrators one starting point for checking availability and choosing a site to inspect.
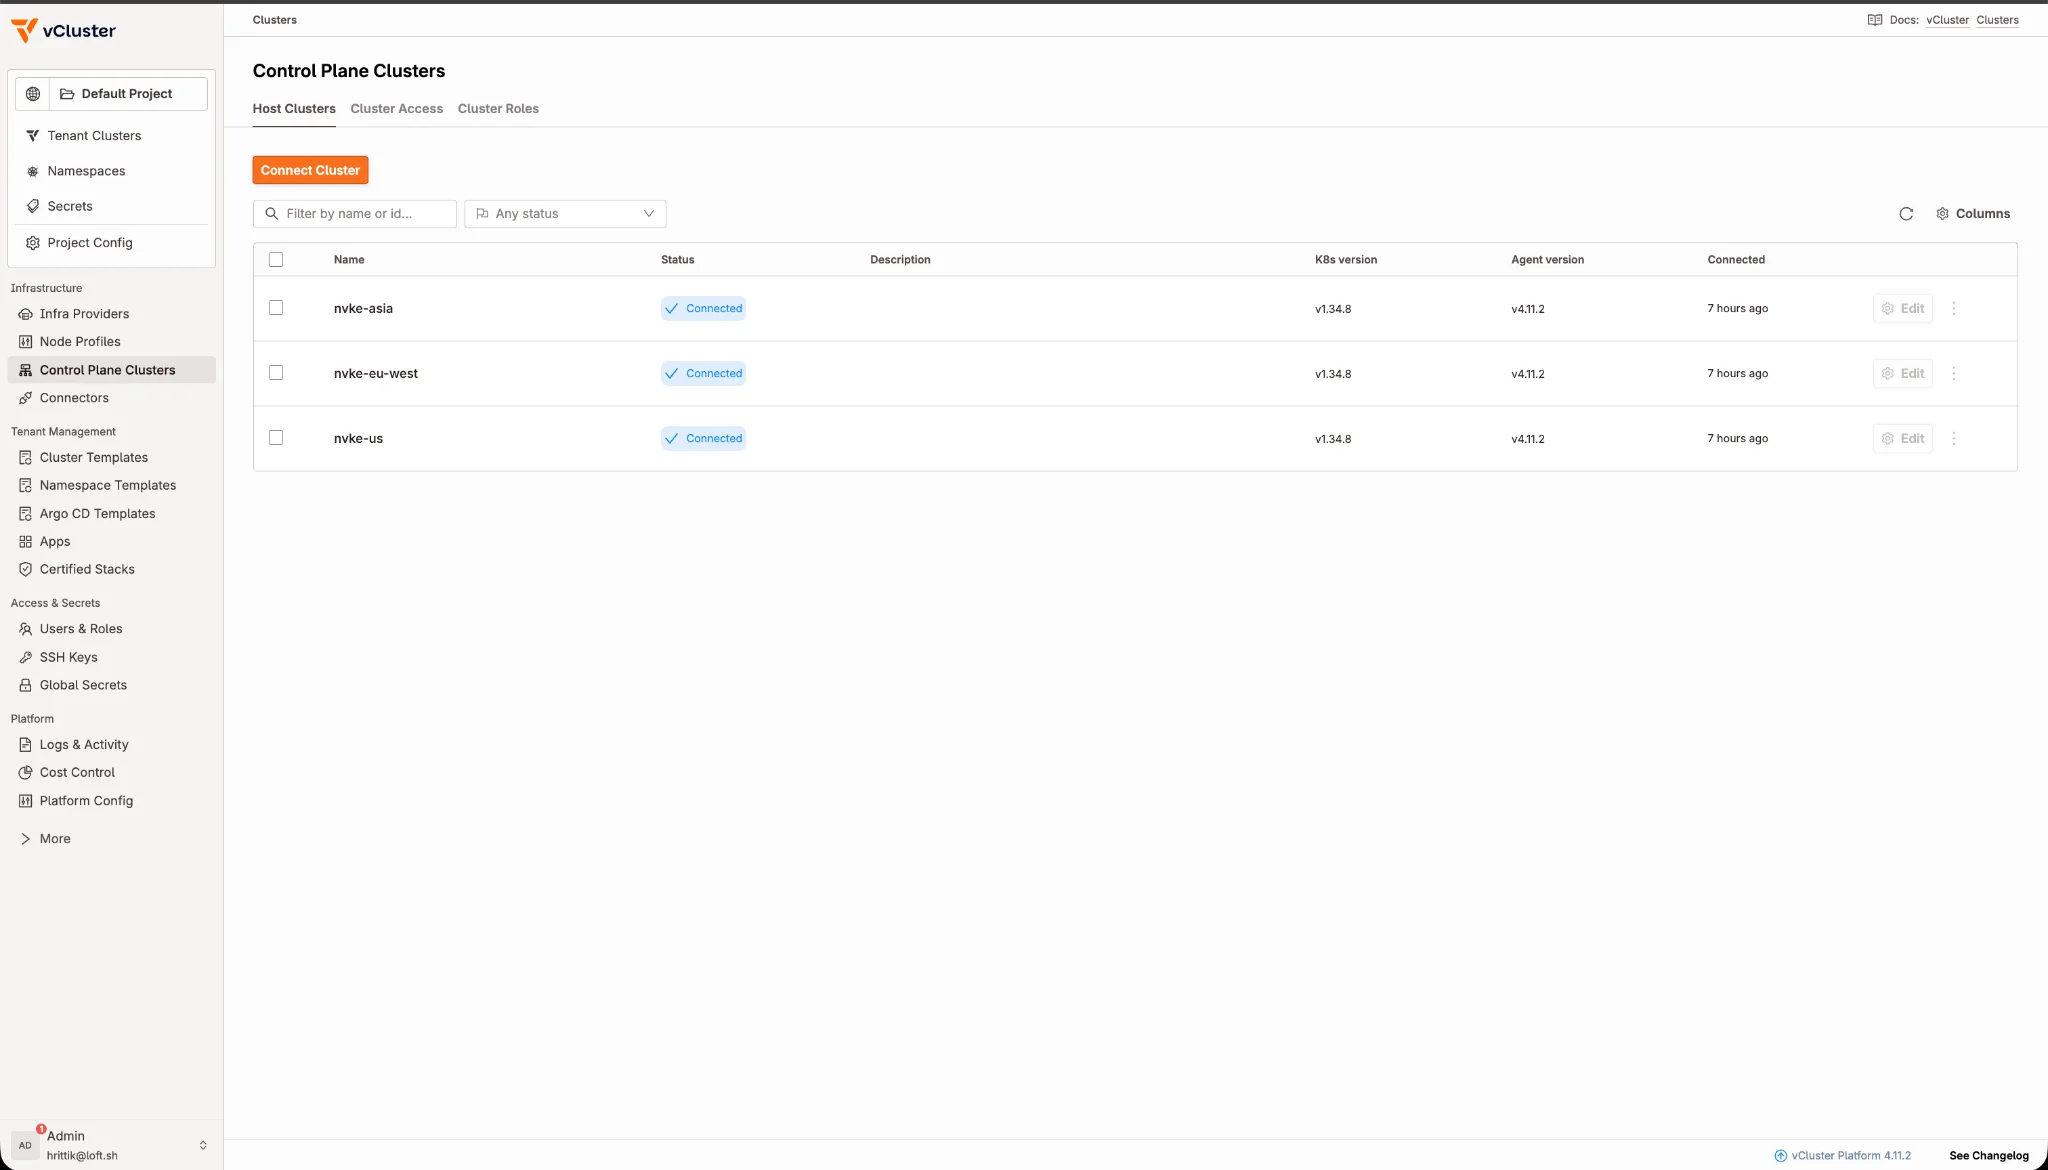
Figure 3: The US, European, and Asian NVKE clusters connected to the same Platform instance.
Select nvke-us and open Nodes to see its nodes and current pod, CPU, memory, and storage usage. Administrators can check these metrics across their NVKE clusters through the same UI. Later, Fleet Observability adds retained metrics and deeper comparisons across clusters.
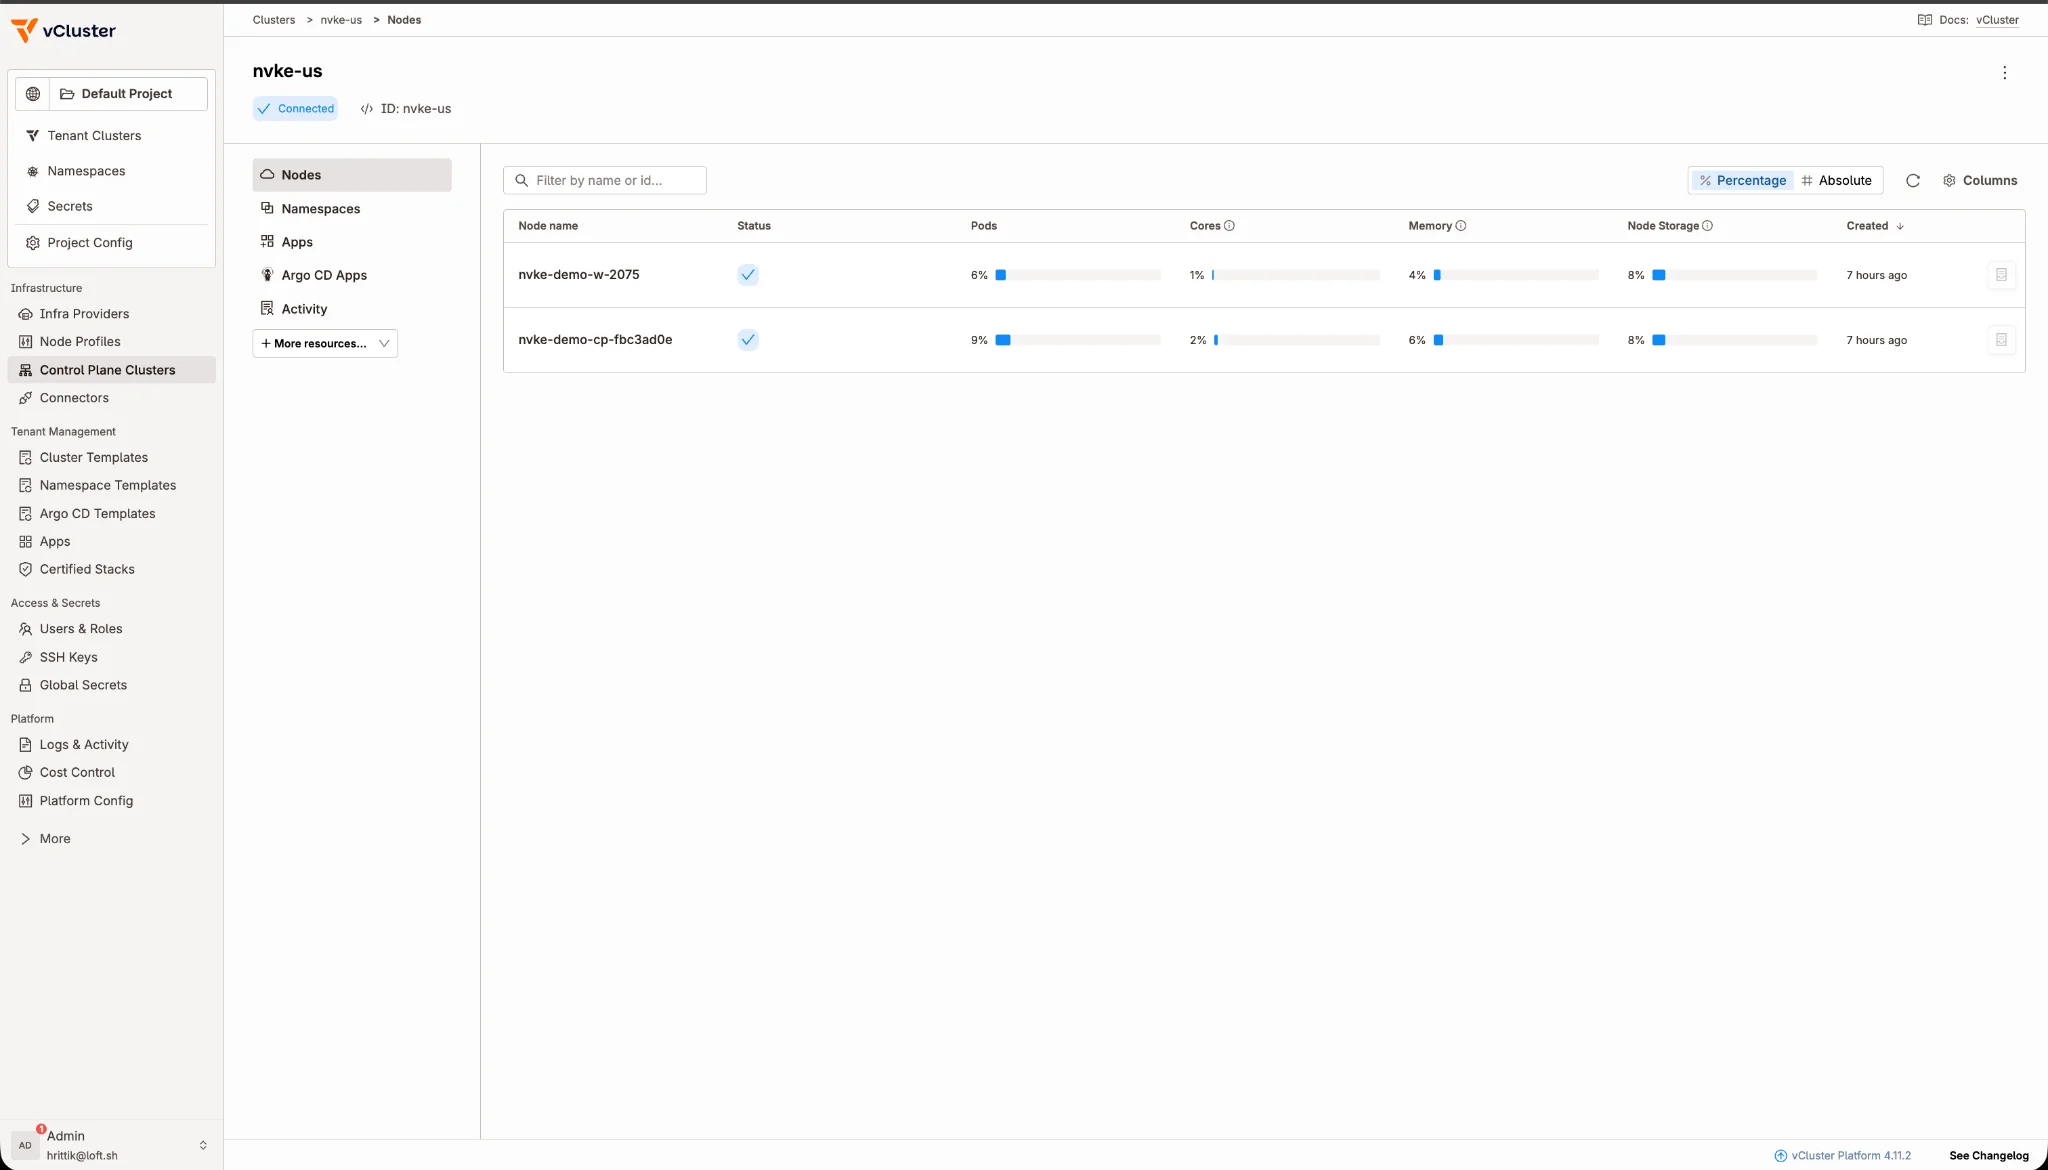
Figure 4: The nvke-us Nodes view shows both nodes and their pod, CPU, memory, and storage usage.
We can now inspect the NVKE fleet centrally. Next, we will look at how Stacks packages the applications teams need.
With the fleet connected, teams still need applications on top of it. An AI team running NVIDIA Run:ai, for example, needs the GPU components, registry access, ingress, application services, and configuration that make the environment usable. Repeating that setup by hand for every team would bring the same installation work back each time.
With vCluster Stacks, you can package that setup once and reuse it for each team, while the central platform team controls access and the configuration offered. A StackTemplate records application tasks, dependencies, and inputs. Platform creates a StackInstance, follows that graph, and tracks each task's progress, so if installation pauses, you can see which prerequisite is waiting.
The Run:ai example shows namespaces, registry configuration, ingress, GPU components, and the backend in one graph. Each task waits for its prerequisites and can consume values produced earlier, so a step that needs a GPU component or an ingress endpoint runs only after that step reports healthy.
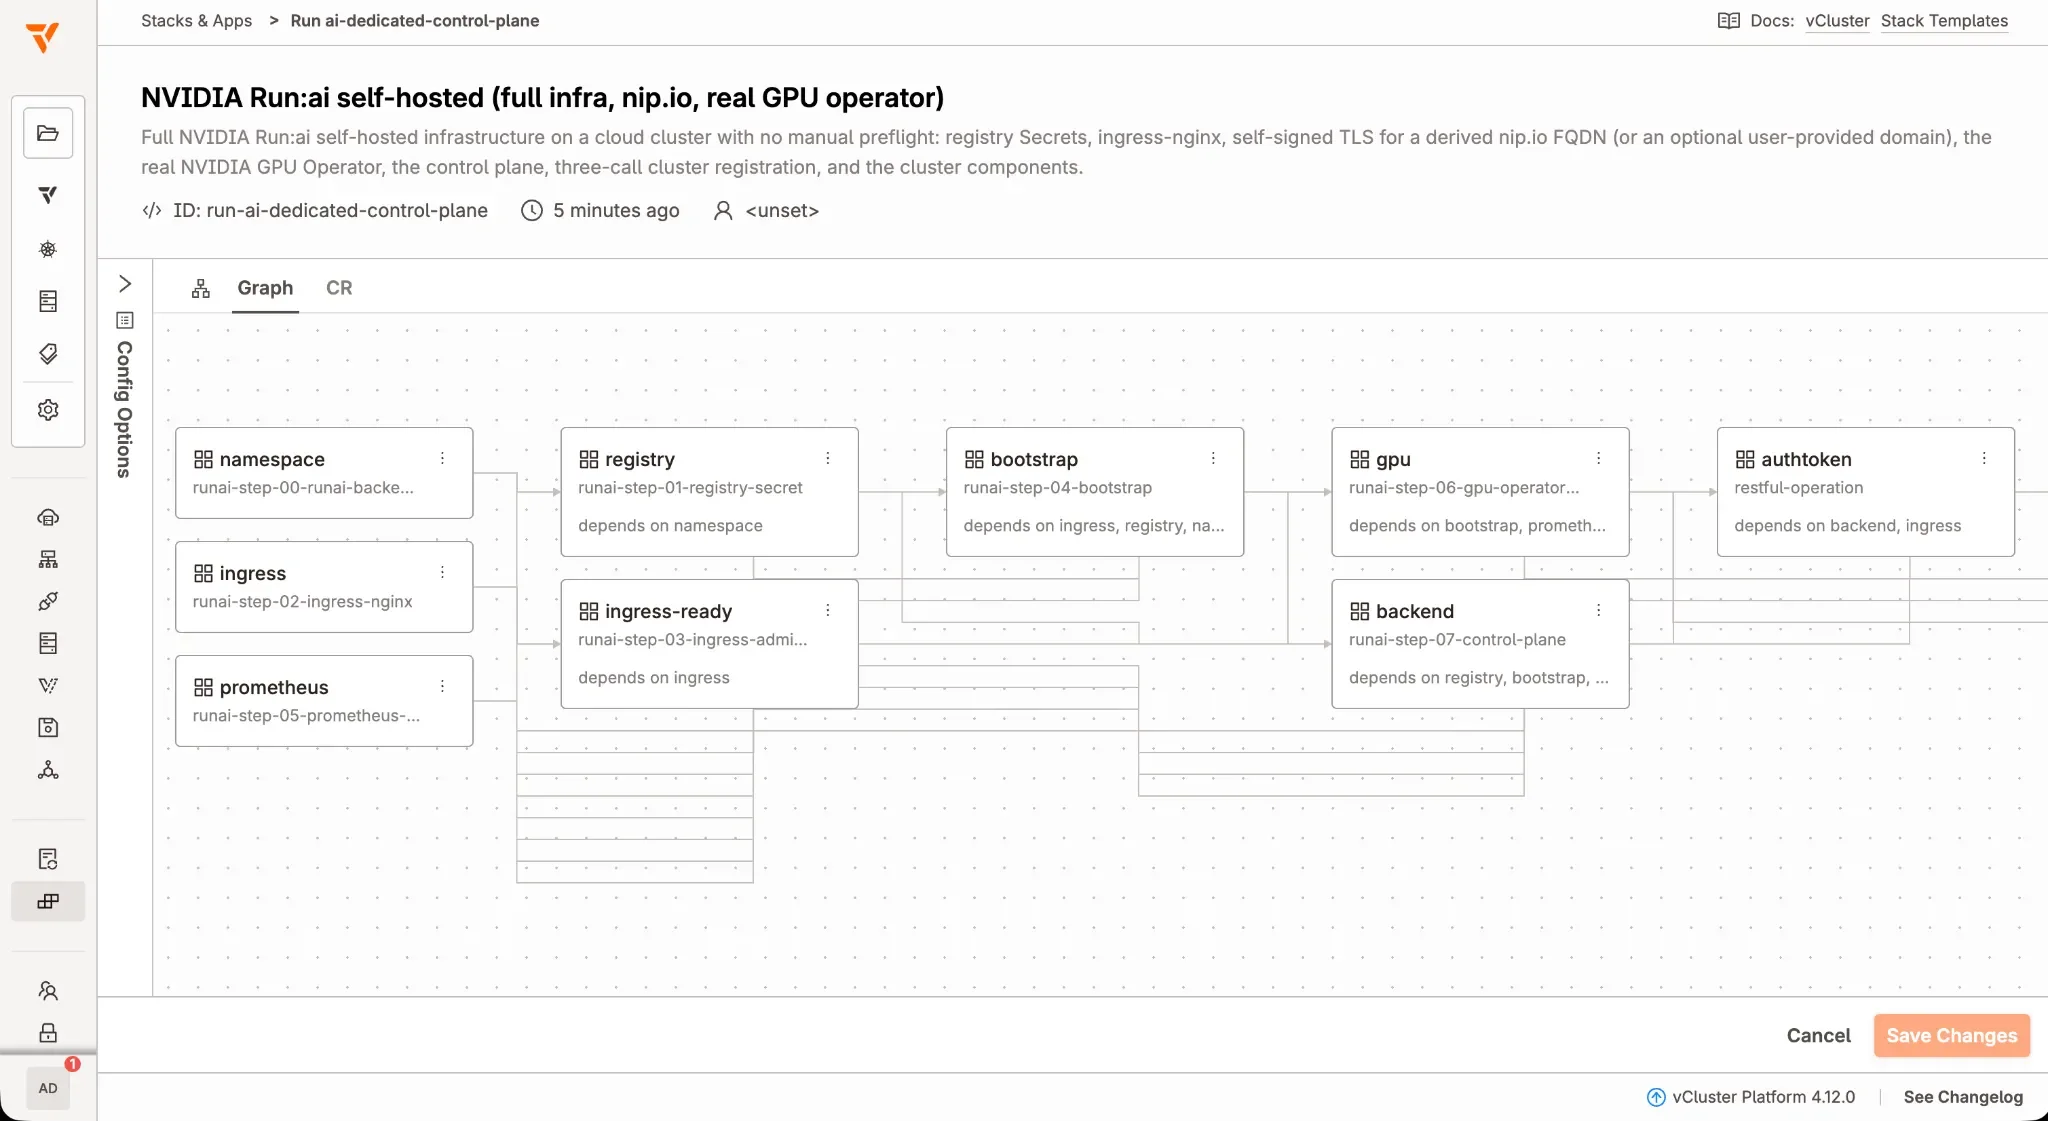
Figure 5: Task dependencies in the NVIDIA Run:ai example from the Stacks walkthrough. This illustrates the orchestration model used to package an application environment. Source post.
We don't deploy Run:ai here because the mock sites have no GPUs. For a complete run on GPU infrastructure, including the task graph and the checks that confirm its GPUs are visible, see my earlier walkthrough, Standing Up NVIDIA Run:ai as a Repeatable Stack. You can also author a custom Stack for another application or configuration.
As teams run more workloads, the next operating question is how they affect capacity across the fleet.
Now suppose a team reports that its workloads are waiting, while another asks whether the Asian site has room for a new environment. You need to understand what is happening across the connected NVKE clusters: which nodes are busy, how resource usage is changing, and which workload is responsible for the demand. Begin by checking that each cluster exposes current CPU and memory readings:
./nvke-gcp.sh kubectl get apiservice v1beta1.metrics.k8s.io
./nvke-gcp.sh kubectl top nodes
Once the metrics API is available, the node command should return current CPU and memory usage. These readings support the administrative view we saw earlier. To answer the team's next question, such as whether usage has been growing throughout the day or only since a rollout, we need retained metrics and a way to compare environments.
Fleet Observability adds that retained, fleet-wide view. Collectors on each connected cluster push metrics through a Write Gateway that attaches trusted cluster identity, and Grafana reads through a Query Proxy that scopes what each reader can see. For the NVKE sites, you configure collectors with control-plane-cluster scope so each site's metrics arrive under its own identity. You can then compare CPU and memory across sites and drill into the cluster that needs attention. On GPU sites, DCGM metrics add utilization, memory, temperature, and power views.
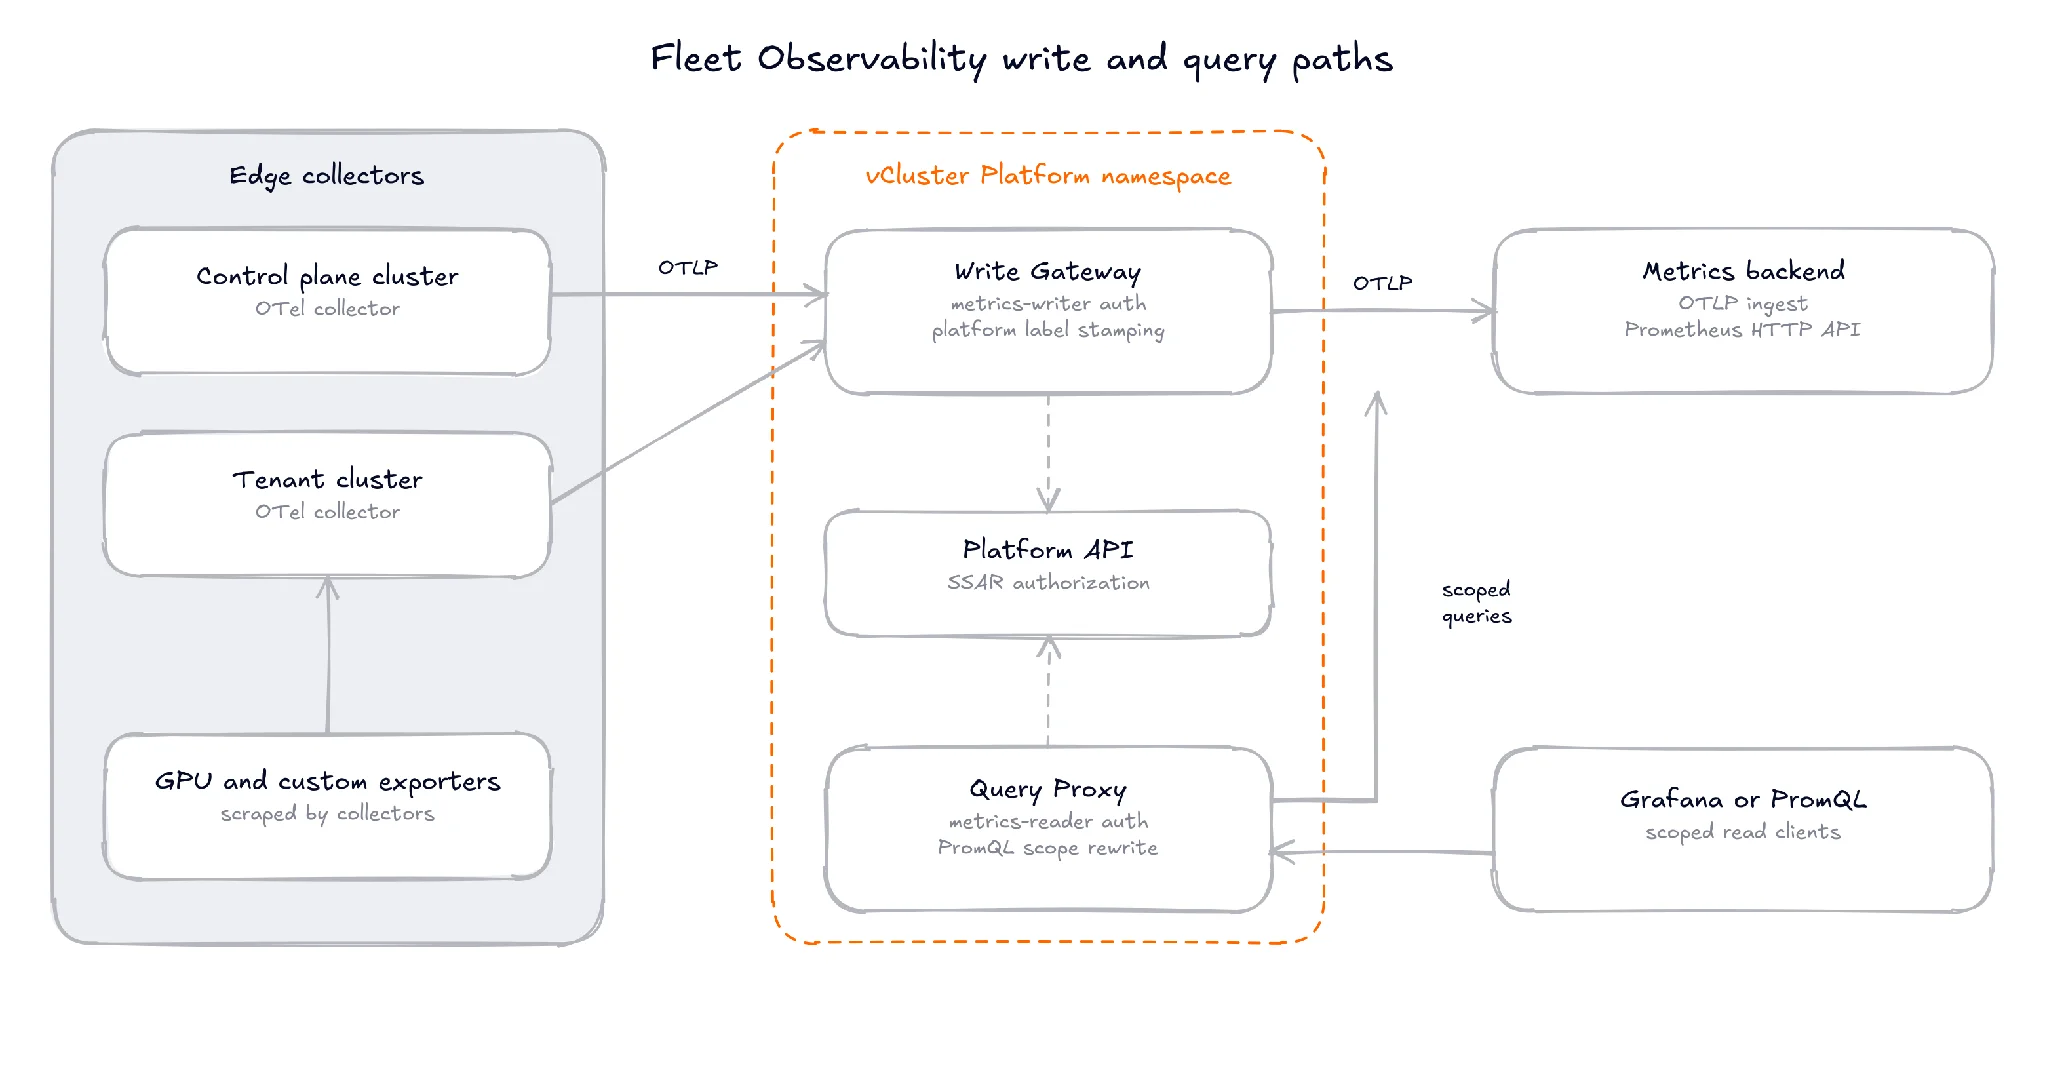
Figure 6: The write and query paths from the Fleet Observability walkthrough. Collection remains local, while ingestion and querying share a platform-managed access boundary. Source post.
I covered the full setup, from the backend to a populated dashboard, in Fleet Observability with vCluster Platform.
The dashboard below comes from the earlier walkthrough, where a sample NGINX deployment makes changes in pod count, CPU, and memory visible under one environment's identity. On the NVKE sites, the same panels would show each site's nodes side by side, so you can compare CPU and memory across regions and open the one contributing to the demand.
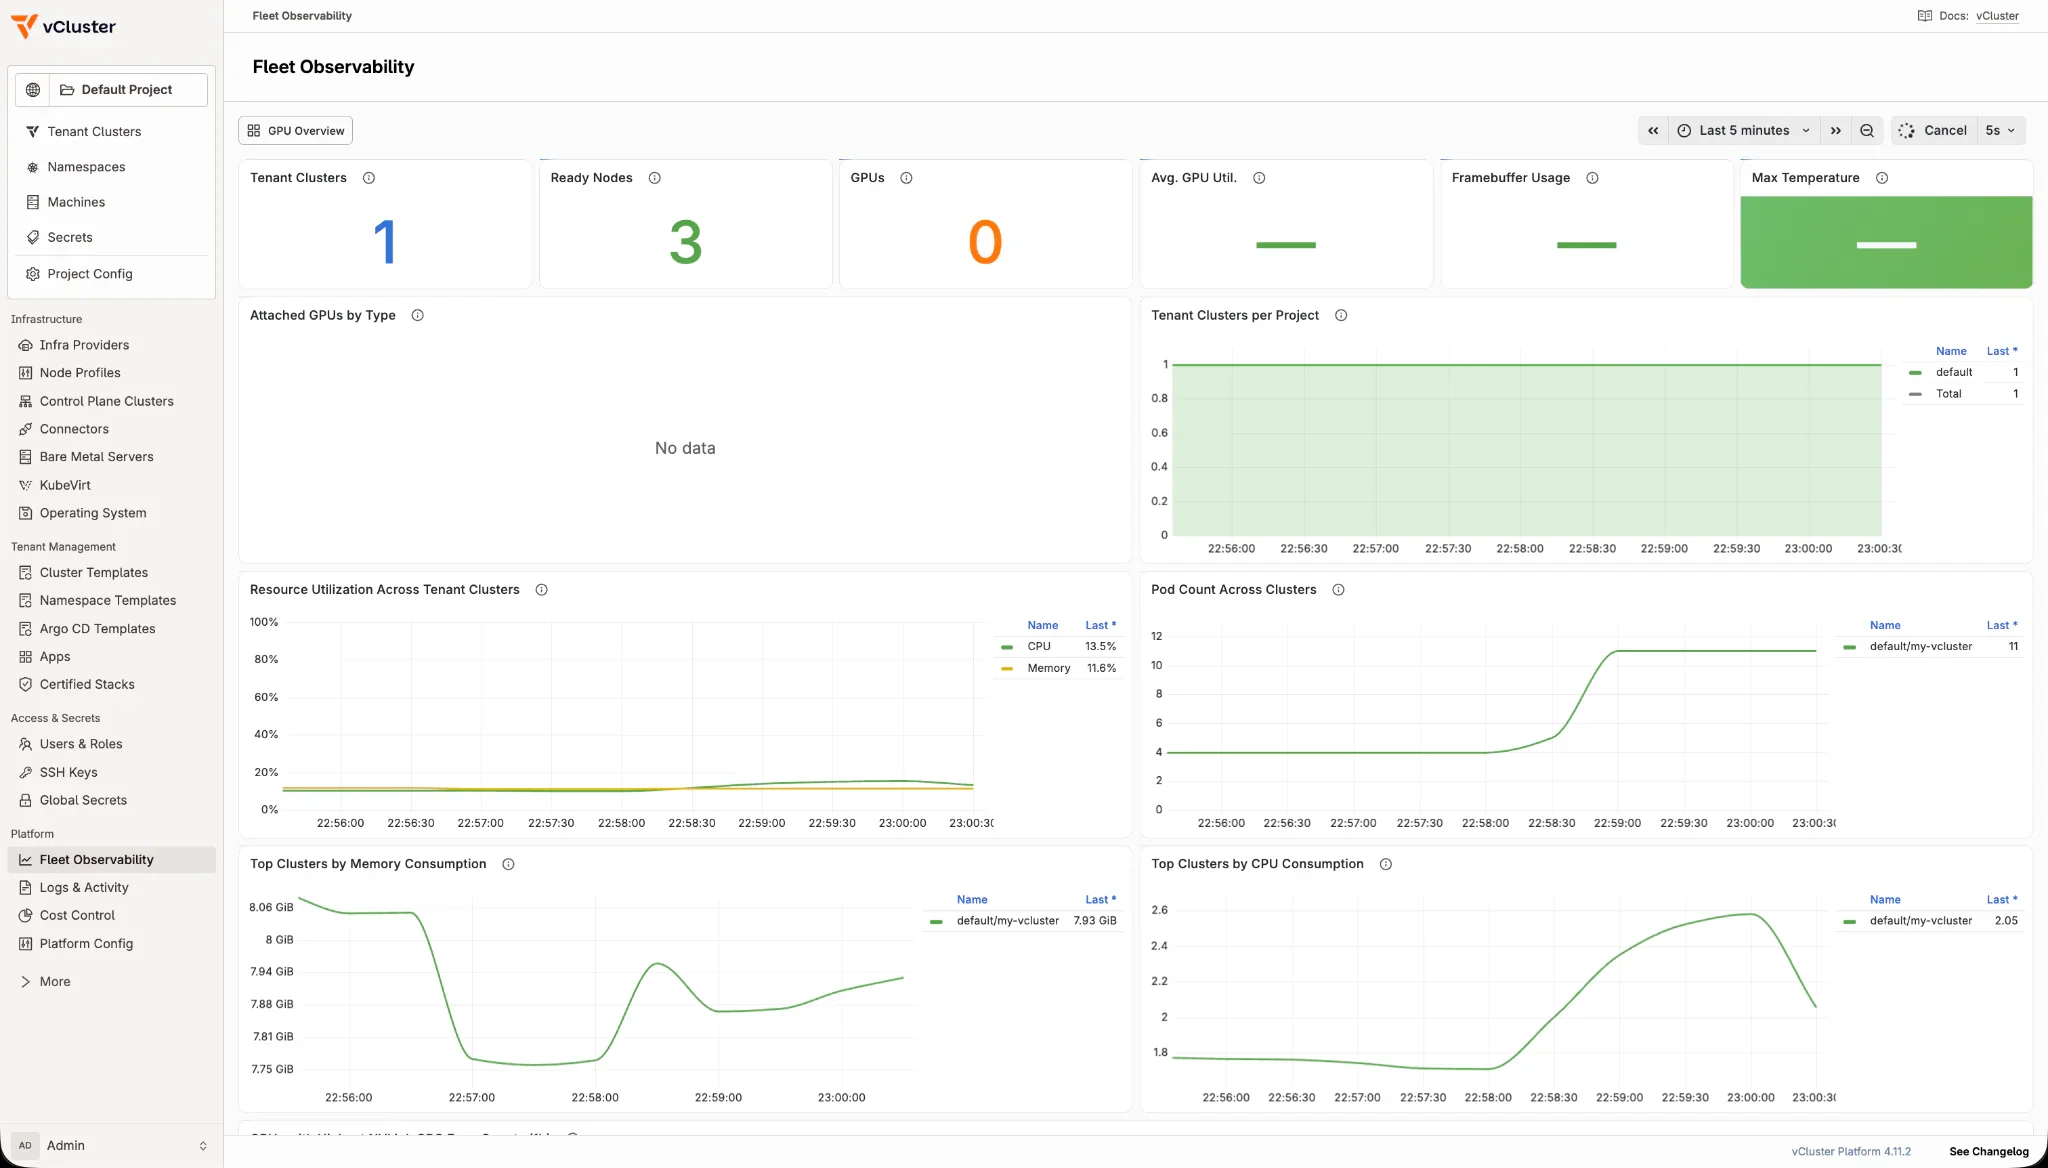
Figure 7: CPU, memory, and pod metrics from the earlier Fleet Observability demo after deploying NGINX. Source post.
The fleet inventory shows what is connected, Stacks packages how each environment is assembled, and Fleet Observability shows how the fleet behaves over time. Together, they give a consistent path from a team request to deployment and ongoing operations.
NVKE gives you a repeatable Kubernetes foundation on NVIDIA infrastructure. Connecting those clusters to vCluster Platform brings access management, inventory, and observability into a central workflow, so your platform team can serve multiple sites without building a separate operating routine for each one.
Stacks lets you package the applications teams need, such as NVIDIA Run:ai, and keep the installation steps, inputs, and readiness checks together. Fleet Observability then helps you understand CPU, memory, and GPU utilization across the fleet and decide where to investigate or add capacity. Because the sites in this post are mock VMs, that view covers CPU and memory utilization only. On real NVKE sites, the same setup brings every GPU and its associated metrics into one place, which makes them much easier to manage.
Start with one connected site, then carry the same pattern into the next region. The result is a platform experience in which operators control how infrastructure is offered and teams have a consistent way to use it.
You can find the launch scripts and site configurations in nvke-vcluster-host.
To compare notes or ask questions, join the vCluster community on Slack at slack.vcluster.com.
Deploy your first tenant cluster today.
